Overview
Abstract
We have designed and implemented a generic virtual mechanical ventilator model into Pulse for real-time medical simulation. The universal data model is uniquely designed to apply all modes of ventilation and allow for modification of the fluid mechanics circuit parameters. The ventilator methodology provides a connection to the existing Pulse respiratory system for spontaneous breathing and gas/aerosol substance transport. The existing Pulse Explorer application was extended to include a new ventilator monitor screen with variable modes and settings and a dynamic output display. Proper functionality was validated by simulating the same patient pathophysiology and ventilator settings virtually in Pulse as a physical lung simulator and ventilator setup.
Introduction
Mechanical Ventilators and Positive-Pressure Ventilation
Mechanical ventilators use mechanical means for artificial ventilation to assist or replace spontaneous breathing. Positive pressure ventilation pushes air into the lungs through the airways. Ventilators provide the following benefits [62] :
- The patient does not have to work as hard to breathe - their respiratory muscles rest.
- The patient's as allowed time to recover in hopes that breathing becomes normal again.
- Helps the patient get adequate oxygen and clears carbon dioxide.
- Preserves a stable airway and preventing injury from aspiration.
Taxonomy for Mechanical Ventilation
The terminology of ventilation modes is not globally standardized. Ventilator manufacturers and researchers name new modes even for trivial changes or innovations [205]. The consequence is a chaotic pool of mode terminology, where the number of modes of ventilation has grown exponentially in the last three decades. Existing respiratory care equipment includes hundreds of unique names of modes on more than 30 different ventilators. To meet the needs of a Pulse mechanical ventilator model, all existing modes of ventilation were generalized to an accurate and manageable set of configuration parameters. This requires an understanding of the base taxonomy of mode definitions used by respiratory care professionals. Previous work has been done to classified modes of ventilation through 10 fundamental constructs of ventilator technology in order to define the three basic components [57] : (1) ventilator breath control variable, (2) the breath sequence, and (3) the targeting scheme. We have leveraged this theoretical basis of taxonomy and standard ontologies [54] for our definitions of ventilator settings that are exposed to Pulse users and applications.
Requirements
A robust Pulse mechanical ventilator model is needed for several different use cases, including clinical investigations, training simulators, and hardware-in-the-loop applications. This new ventilator model required a generic representation of a positive-pressure ventilation device with functionality for inhaled gas/agent administration. It needed to integrate with the existing Pulse respiratory fluid mechanics circuit and transport graph using the same physics-based fidelity previously implemented with legacy equipment models. Therefore, a mechanistic modeling approach was employed to allow all existing Pulse functionality for patient-specific physiologies and pathophysiologies to be simulated with the addition of artificial ventilation. Feedback between the respiratory system and the mechanical ventilator was required to trigger assisted modes from patient spontaneous breaths [392] , while still allowing for equipment initiated modes of ventilation. The new Pulse mechanical ventilator methodology also needed to be modular to allow the simulation of all conventional and adaptive ventilation modes [205], as well as various equipment brands and models with disparate definitions for settings, sensors, and interfaces. Extensibility was required to interface with real-world cyber-physical systems, including prototype equipment for in silico trials.
While other ventilator virtual software and computational models exist [154] [211], none are suitable for direct integration into Pulse. Existing software is often hardcoded with other physiology models and not modular enough for extraction, not realistic/high-fidelity enough for integration with Pulse's lumped parameter approach, too focused on specific modes and pathophysiological states, and/or is closed-source without a permissive license. Therefore, a new approach was required.
System Design
Features and Capabilities
Circuit
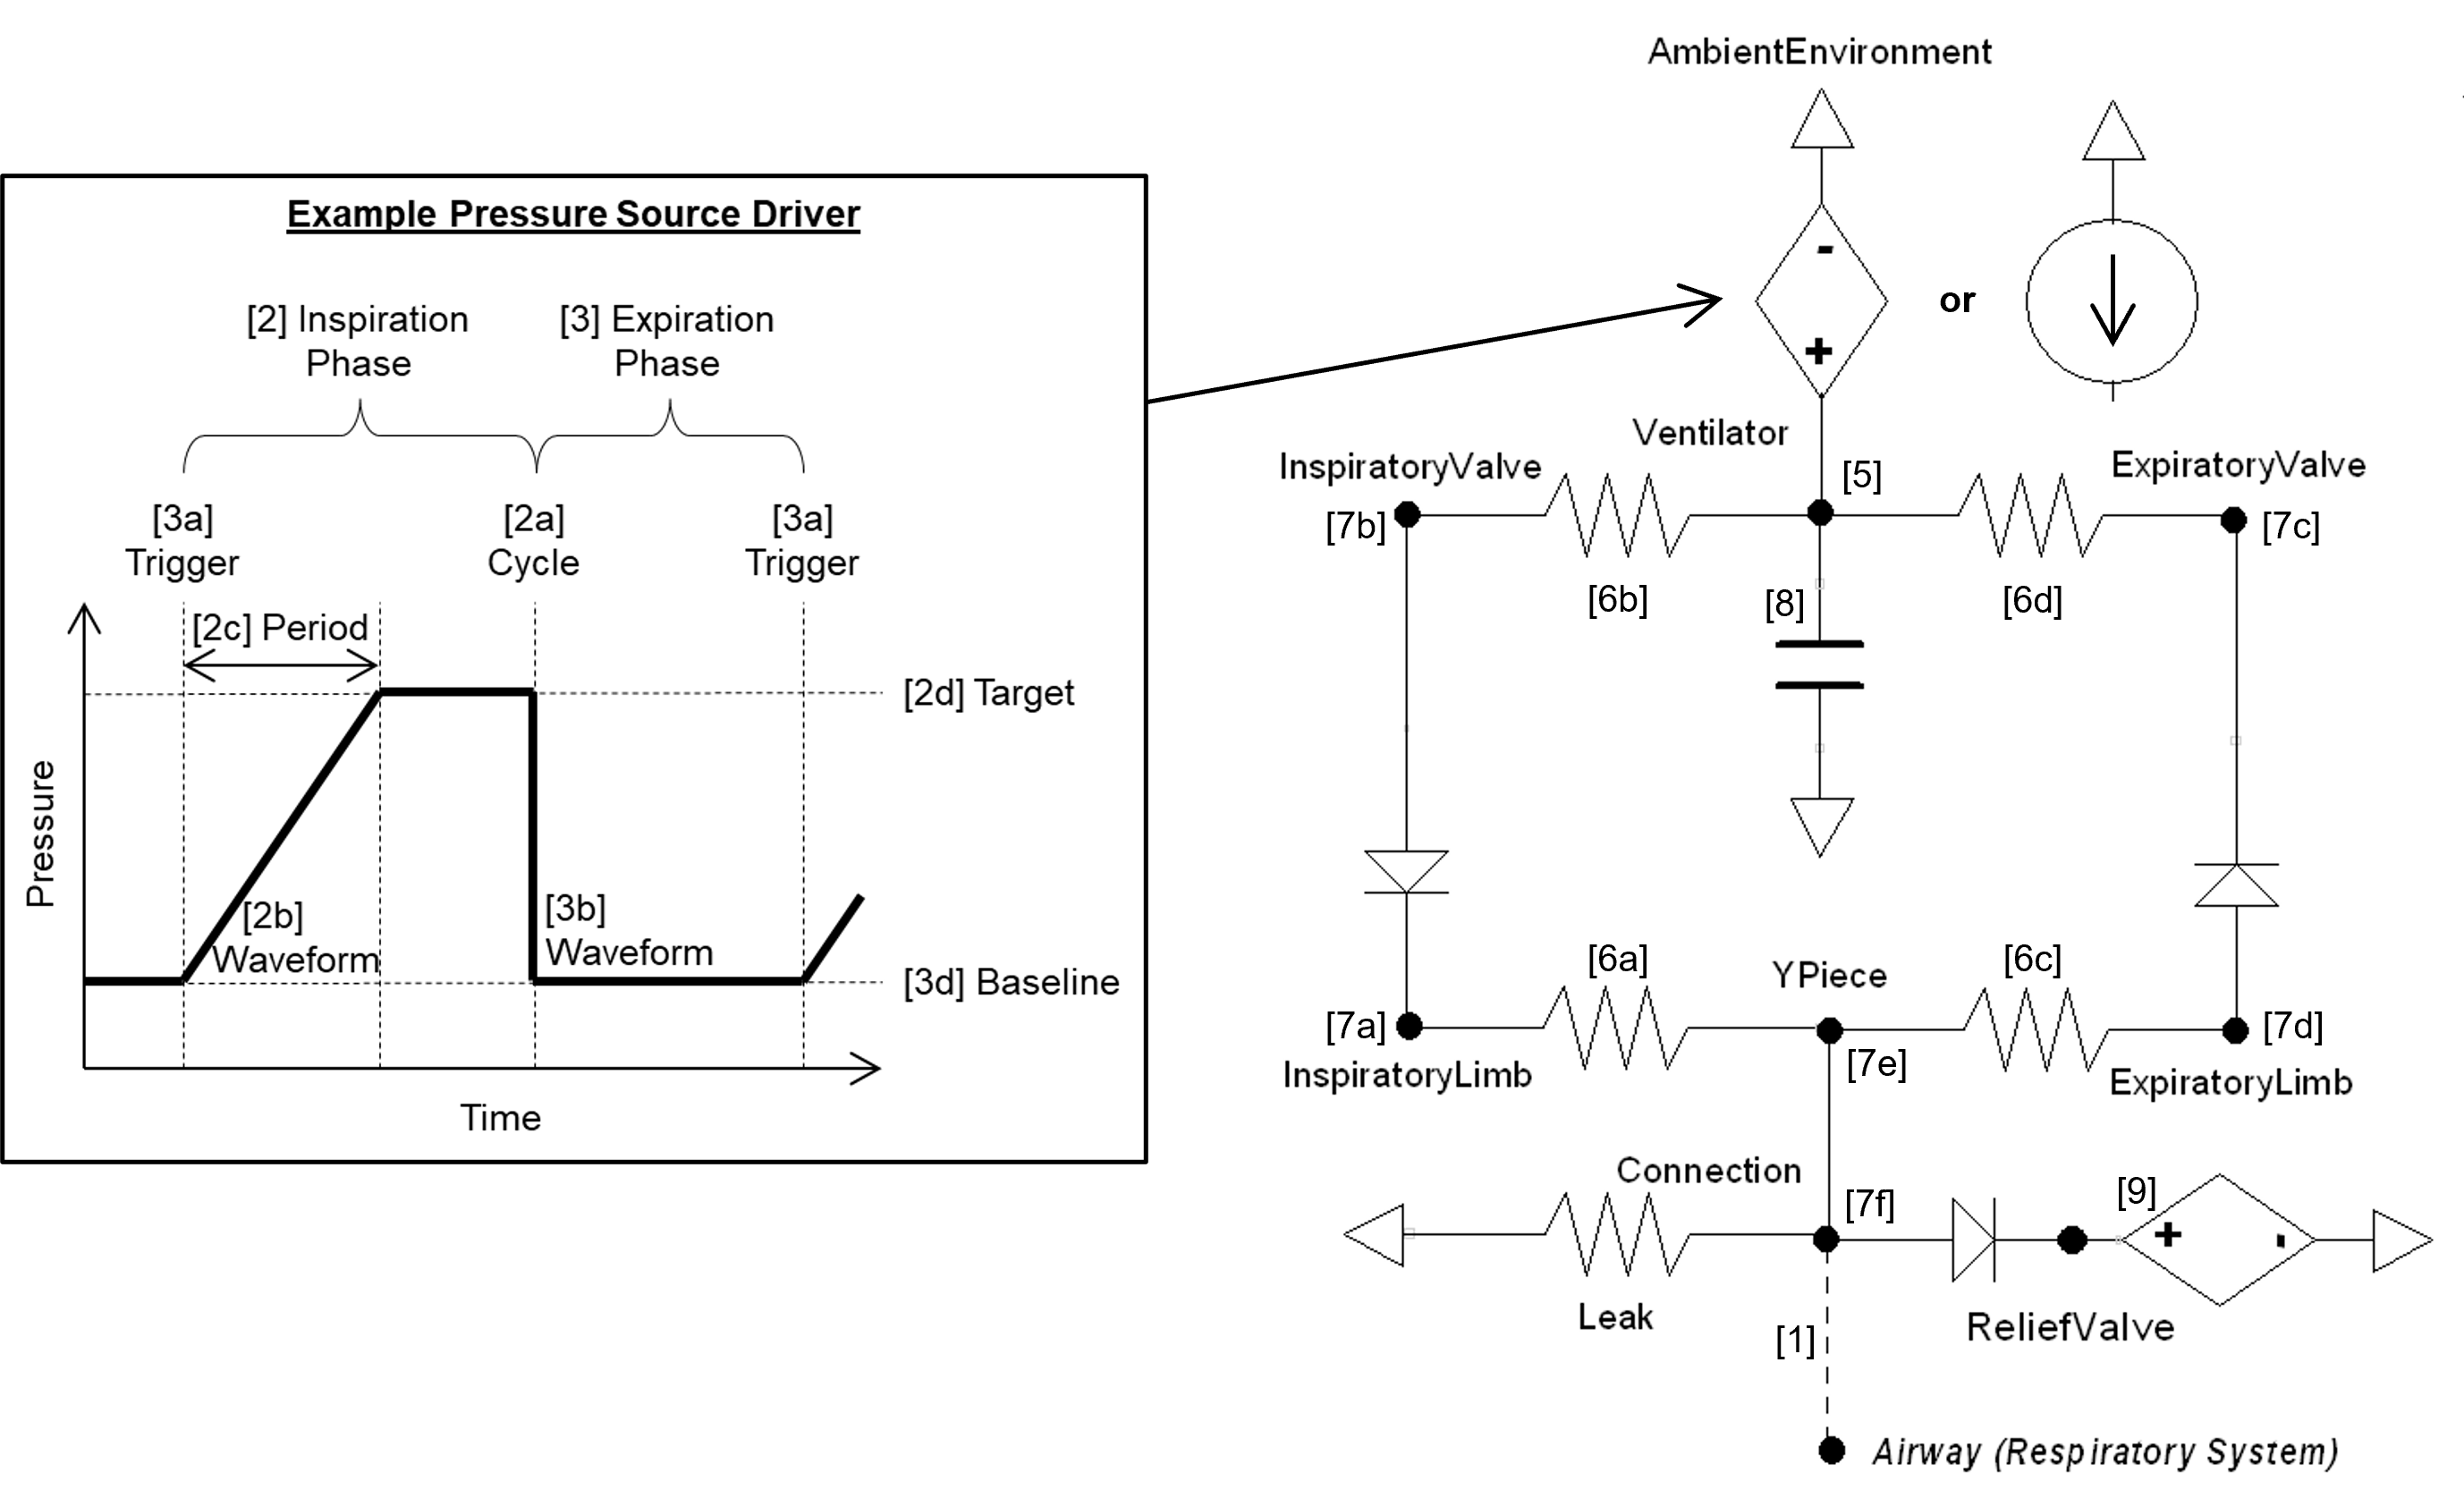
The mechanical ventilator model consists of a pressure/flow source with tubes and valves for inspiration and expiration. The unidirectional valves are ideal and do not allow any backflow. Figure 1 shows the mechanical ventilator circuit. The compartments and transport graph mirrors the circuit. Substance values are set on the ventilator node/compartment, assuming infinite volume. The ventilator interacts with the existing respiratory circuit through a direct connection that allows air (gases and aerosols) to flow freely. A path connects the airway node of the respiratory system to the connection (mask or tube) node of the ventilator. When the machine is turned on, both individually defined circuits are combined into a single, closed-loop circuit that is solved as a single linear algebra matrix.
Connecting to the Respiratory Circuit
When an mechanical ventilator is used on a patient, there is a direct connection that allows air to flow freely between both. In the same fashion, the Mechanical Ventilator and Respiratory circuits in the engine are directly connected and allowed to share the same fluid. When the machine is turned on, both individually defined circuits are combined into a single circuit that is then used for calculations.
Settings
We have designed the ventilator to integrate with the existing CDM/API architectures using these Pulse software framework features. The goal of the ventilator data model is to distill all possible mode taxonomies into a minimal, generalized set of configuration parameters that can be parsed by the internal engine methodology. To achieve this, the settings do not include mode definitions specifically, but are instead a logical layer that defines the lower level parameters necessary for breath phase definitions. Much of the mechanical ventilator data model is focused on the calculation of the instantaneous pressure/flow source required to drive the circuit (see 2-4 below). These temporal functions are an important part of the transient fluid mechanics analysis used in Pulse simulations. Each time-step the ventilator model must update circuit parameters to their proper value based on the current phase in the breath cycle and configuration settings. Other configuration parameters define the fluid mechanics circuit elements (see 1 and 6-9 below) and values for the substance transport graph (see 5 below).
The Mechanical Ventilator configuration parameters were defined to allow for setting any ventilation modes - all control variable types and all breath sequences. While these definitions are intended to be all-encompassing, the data model has been implemented to allow for the addition of new features in the future. Logical checks are included to ensure minimal required settings are defined and conflicting values are handled. The hierarchical configuration definitions are:
- 1. Connection: Connection type to the respiratory system (Off, Mask, Tube)
- 2. Inspiration Phase
- (a) Cycle: Transition to pause/expiration
- i. Machine Cycle: Control cycles
- A. Time: Total length of inspiration phase to trigger expiration phase
- ii. Patient Cycle: Assisted cycles
- A. Pressure: Ventilator sensor pressure value to trigger expiration phase
- B. Flow: Ventilator sensor flow value to trigger expiration phase
- C. Volume: Ventilator sensor volume change (tidal volume) to trigger expiration phase
- D. Respiratory Model: Trigger expiration phase from respiratory model event
- i. Machine Cycle: Control cycles
- (b) Waveform: Pattern of driver function (square, exponential, ramp, sinusoidal, sigmoidal)
- (c) Waveform Period: Time to reach maximum driver value
- (d) Target: Driver value set-point
- i. Pressure (PIP): Extrinsic pressure above atmosphere at the end of inhalation
- ii. Flow: Air flow at end of inhalation
- (e) Limit: Cutoff/Maximum
- i. Pressure: Ventilator sensor pressure cutoff/maximum
- ii. Flow: Ventilator sensor flow cutoff/maximum
- iii. Volume: Ventilator sensor total lung volume cutoff/maximum
- (f) Pause: Time of plateau (i.e., constant driver pressure) between inspiration and expiration
- (a) Cycle: Transition to pause/expiration
- 3. Expiration Phase
- (a) Trigger: Transition to inspiration
- i. Machine Trigger: Control triggers
- A. Time: Total length of expiration phase to trigger inspiration phase
- ii. Patient Trigger: Assisted triggers
- A. Pressure: Ventilator sensor pressure value to trigger inspiration phase
- B. Volume: Ventilator sensor volume change value to trigger inspiration phase
- C. Respiratory Model: Trigger inspiration phase from respiratory model event
- i. Machine Trigger: Control triggers
- (b) Waveform: Pattern of driver function (square, exponential, ramp, sinusoidal, sigmoidal)
- (c) Waveform Period: Time to reach minimum driver value
- (d) Baseline: Value to set/achieve
- i. Pressure (PEEP): Extrinsic pressure above atmosphere at the end of exhalation
- ii. Volume (FRC): Total lung volume at the end of exhalation
- (a) Trigger: Transition to inspiration
- 4. Driver Damping Parameter: Fractional change parameter to prevent abrupt changes and discontinuities (i.e., smoother driver curve)
- 5. Substances
- (a) Fraction of inspired gas: FiO2 and other gases fractions
- (b) Concentration of inspired aerosol: albuterol, etc.
- 6. Circuit Resistances
- (a) Inspiration tube resistance: Total resistance of inspiratory limb tubing
- (b) Inspiration valve resistance: Total resistance of inspiratory valves
- (c) Expiration tube resistance: Total resistance of expiratory limb tubing
- (d) Expiration valve resistance: Total resistance of expiratory valves
- 7. Circuit Volumes
- (a) Inspiratory limb volume: Total volume of inspiratory limb tubing
- (b) Inspiratory valve volume: Total volume of inspiratory valves
- (c) Expiratory tube volume: Total volume of expiratory limb tubing
- (d) Expiratory valve volume: Total volume of expiratory valves
- (e) Y-piece volume: Total volume of the y-piece
- (f) Connection volume: Total volume of the mask/endotracheal tube
- 8. Circuit Compliance: Total compliance of the entire ventilator circuit
- 9. Relief Valve Pressure: Maximum relative pressure allowed
While the parameter list is meant to be all encompassing for all ventilator modes, some typical settings are required to be translated by the user or application. For example, the respiration rate (RR) and I:E Ratio (IE)settings can be translated to an inspiratory period (Pins) and expiratory period (Pexp) by:
![\[{P_{tot}}[s] = \frac{{60}}{{RR[bpm]}}\]](form_93.png)
![\[{P_{ins}}[s] = \frac{{IE \cdot {P_{tot}}[s]}}{{1 + IE}}\]](form_94.png)
![\[{P_{exp}}[s] = {P_{tot}}[s] - {P_{ins}}[s]\]](form_95.png)
Where the I:E Ratio (IE) is defined by a fraction, for example 1:2 is 0.5 and 1:1 is 1.0.
Standard ventilator mode settings have been added to allow for more intuitive application of ventilator modes. The following mode settings are automatically translated to the lower level configuration settings that are listed previously in this section. Some setting are not exposed (e.g., trigger flow and cycle flow) at this level and default values are used.
Pressure Control (PC-CMV and PC-AC):
- Fraction of Inspired Oxygen
- Inspiratory Period
- Inspiratory Pressure
- Positive End Expired Pressure
- Respiration Rate
- Slope
Volume Control (VC-CMV and VC-AC):
- Flow
- Fraction of Inspired Oxygen
- Inspiratory Period (optional - if not set, transition to exhale when Tidal Volume achieved)
- Positive End Expired Pressure
- Respiration Rate
- Tidal Volume
Continuous Positive Airway Pressure (CPAP):
- Delta Pressure Support
- Fraction of Inspired Oxygen
- Positive End Expired Pressure
- Slope
Actions
The ventilator model includes the application of leak and hold actions.
The leak severity is translated to the connection to environment resistance to allow more or less air to escape.
The hold action can be set to be applied instantaneously, at the end of the expiration cycle, or at the end of the inspiration cycle. When the hold is active, the driver will be set to a zero flow source. The hold will remain applied until explicitly removed by the user.
Data Flow
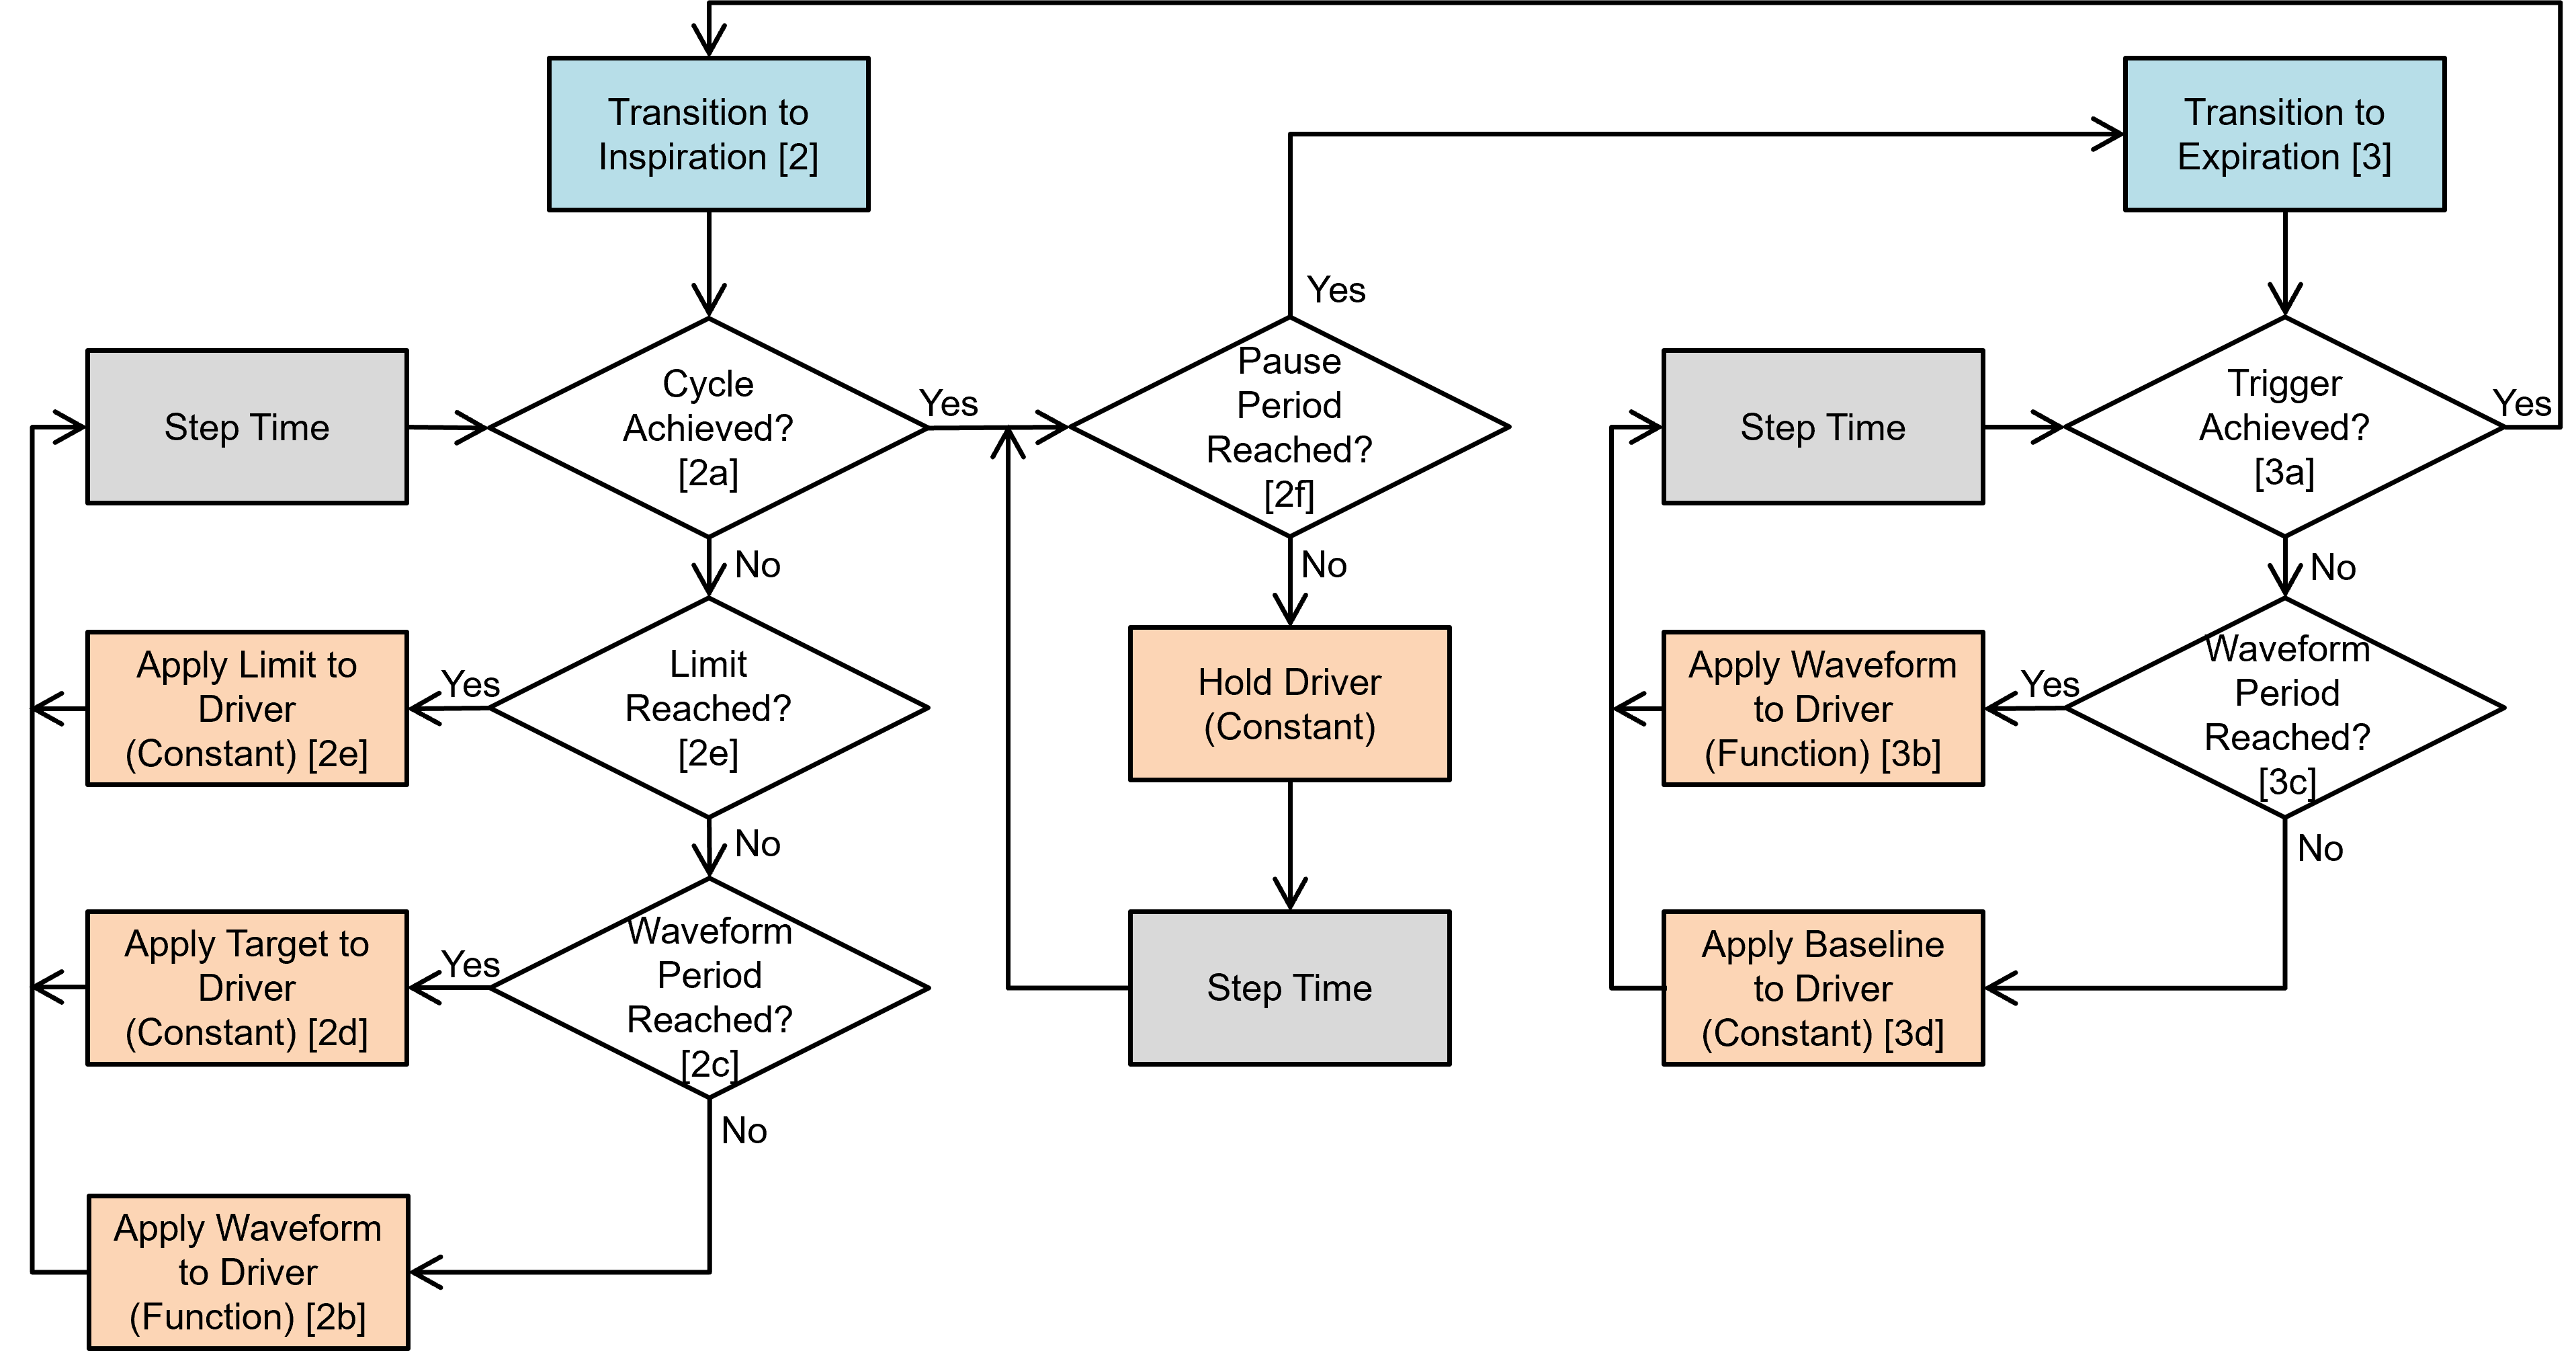
The mechanical ventilator model follows the same logic loop as all Pulse systems, as shown in Figure 2. The state at every time-step is determined through a three-step process: 1) a preprocess step determines the circuit element values based on feedback mechanisms and engine settings/actions, 2) a process step uses the generic circuit calculator and substance transporter to compute the entire state of the circuit and fill in all pertinent values, and 3) a postprocess step is used to advance time.
The software logic we implemented is meant to mimic the control software of real-world ventilators. Feedback is read from locations within the ventilator circuit as if they are from actual sensors. The data model was used to generate a data flow that is distilled down to simple conditionals. The model modifies the ventilator circuit elements each time-step based on the configuration settings and actions and the Pulse circuit solver and transporter handle the fluid mechanics and substance computations.
Dependencies
The Mechanical Ventilator interacts with the Respiratory System through a connection that delivers gases and aerosols into the Respiratory System (see Respiratory Methodology). The two systems are connected to each other through a path that connects the airway node of the Respiratory System to the mask/endotracheal node (referred as Connection in the circuit diagram) of the Mechanical Ventilator System. During spontaneous ventilation, the airway node of the Respiratory System is connected to the atmosphere via the Environment System. This serves as a ground node for the Respiratory System.
When the Mechanical Ventilator is connected, a network of combined circuits that include the elements from both the Respiratory and Ventilator Systems is created. When the combined circuit is generated at runtime, the ground environment node connected to the mouth node of the Respiratory System is replaced by the Connection node that represents the mask/endotracheal node, becoming one combined circuit. Apart from such interaction, the Ventilator System is also responsive to the flow resistances of the Respiratory System. In this regard, the ventilator driver pressure serves as a positive-pressure source for the combined circuit. The Ventilator is linked to the Environment System that regulates the atmospheric/reference pressure.
Assumptions and Limitations
Currently, the Mechanical Ventilator uses ideal pressure sources and one-way valves. Only setting appropriate for a PC-CMV, VC-CMV, PC-AC, VC-AC, and CPAP modes are tested. However, the system is defined and implemented to allow for future mode expansion without data model changes.
Results and Conclusions
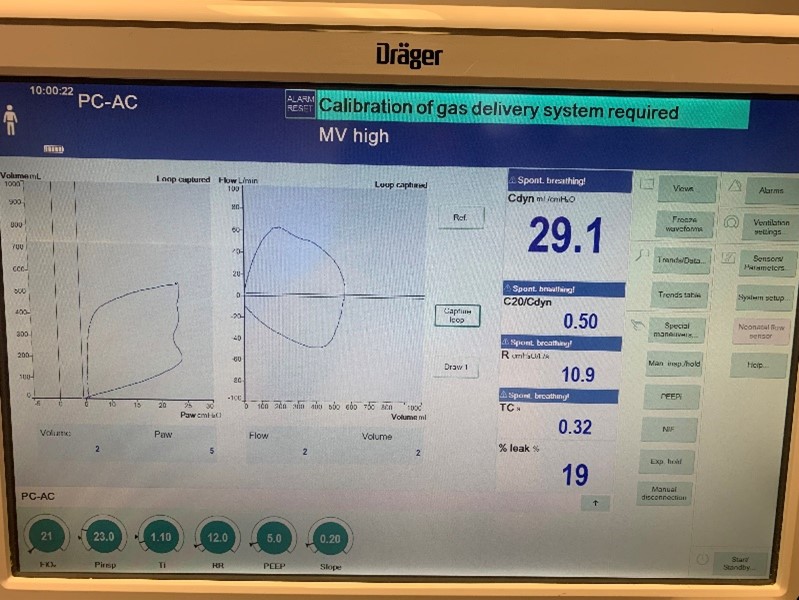
Validation - Breathing Simulator Comparison
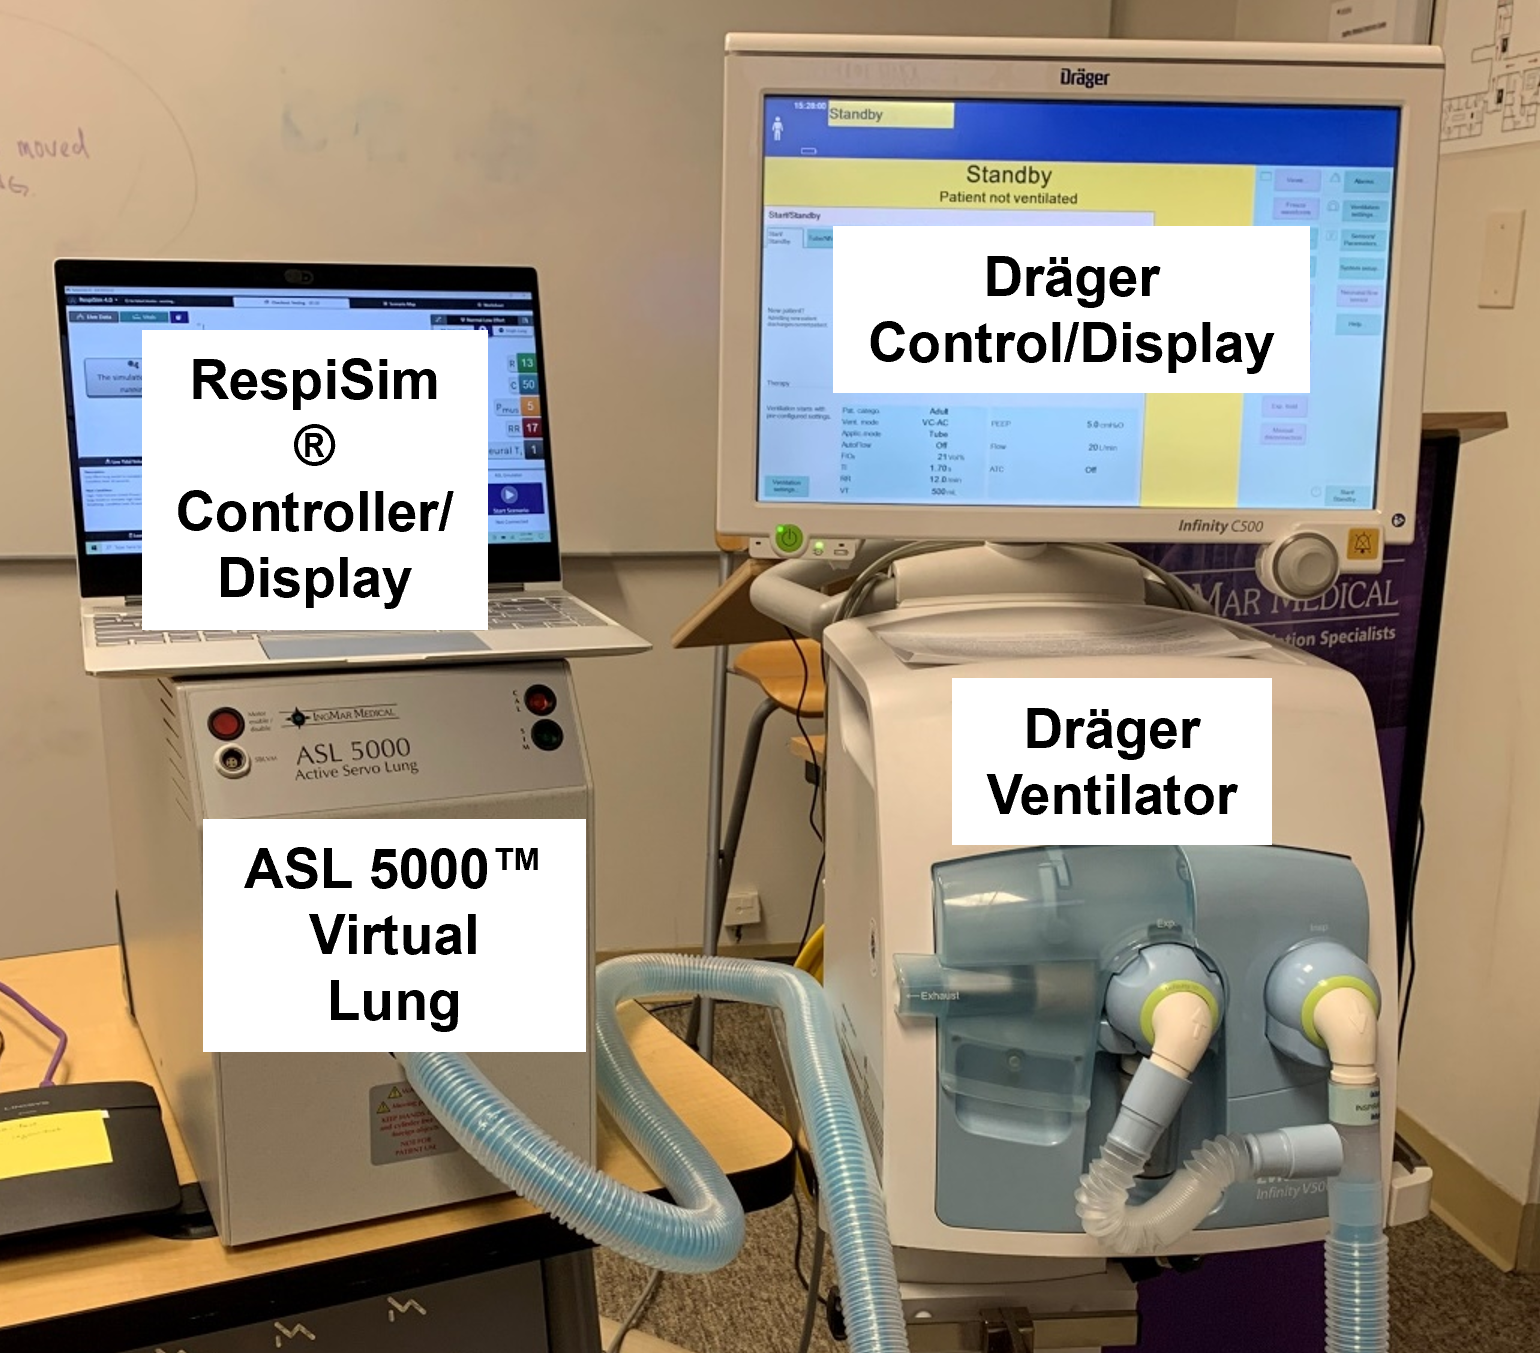
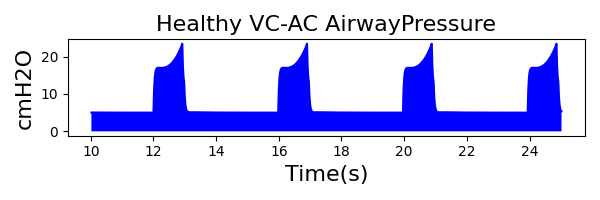
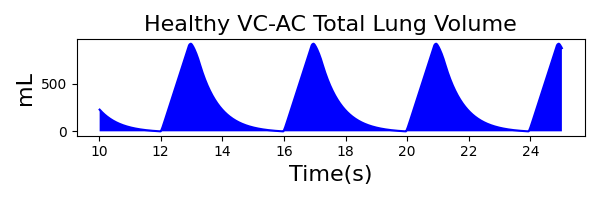
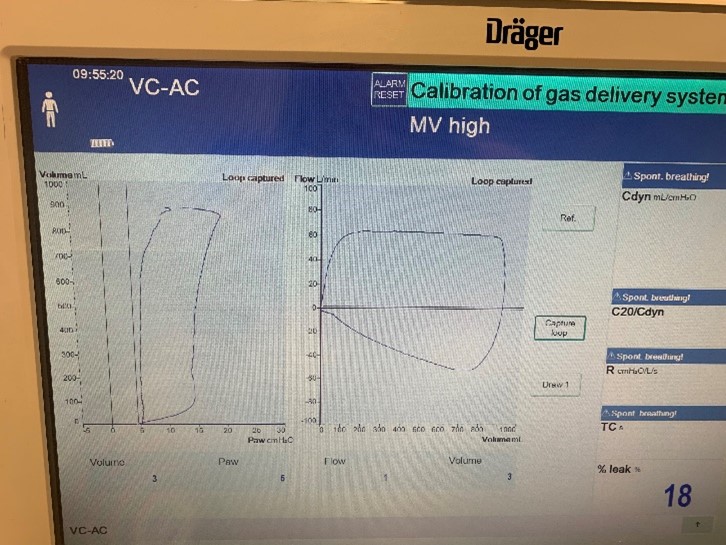
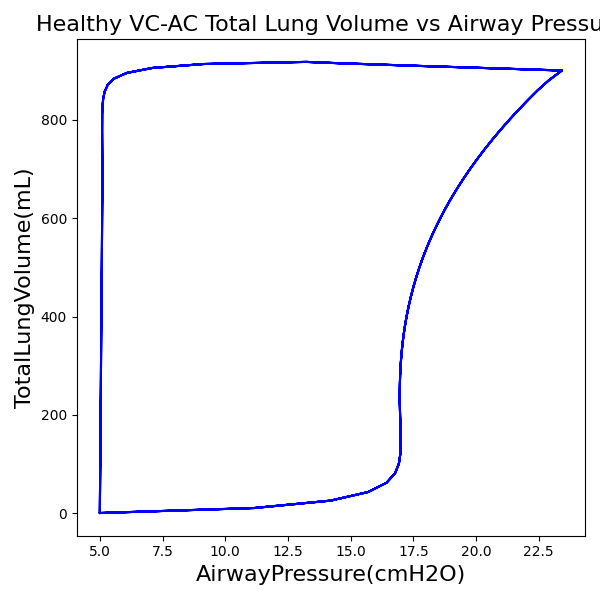
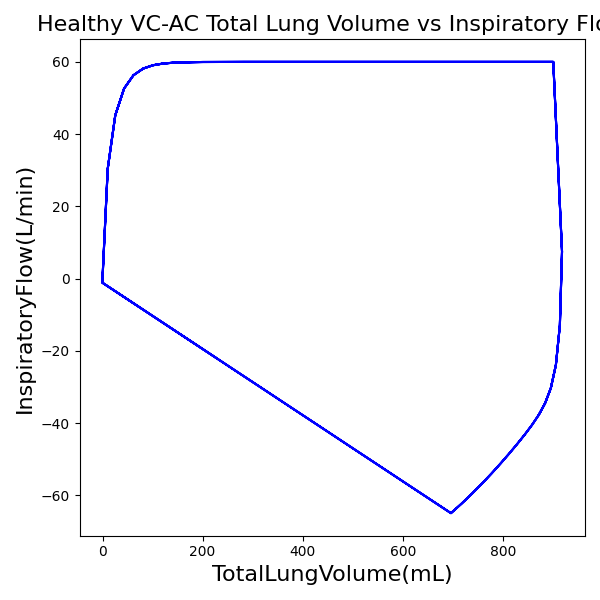
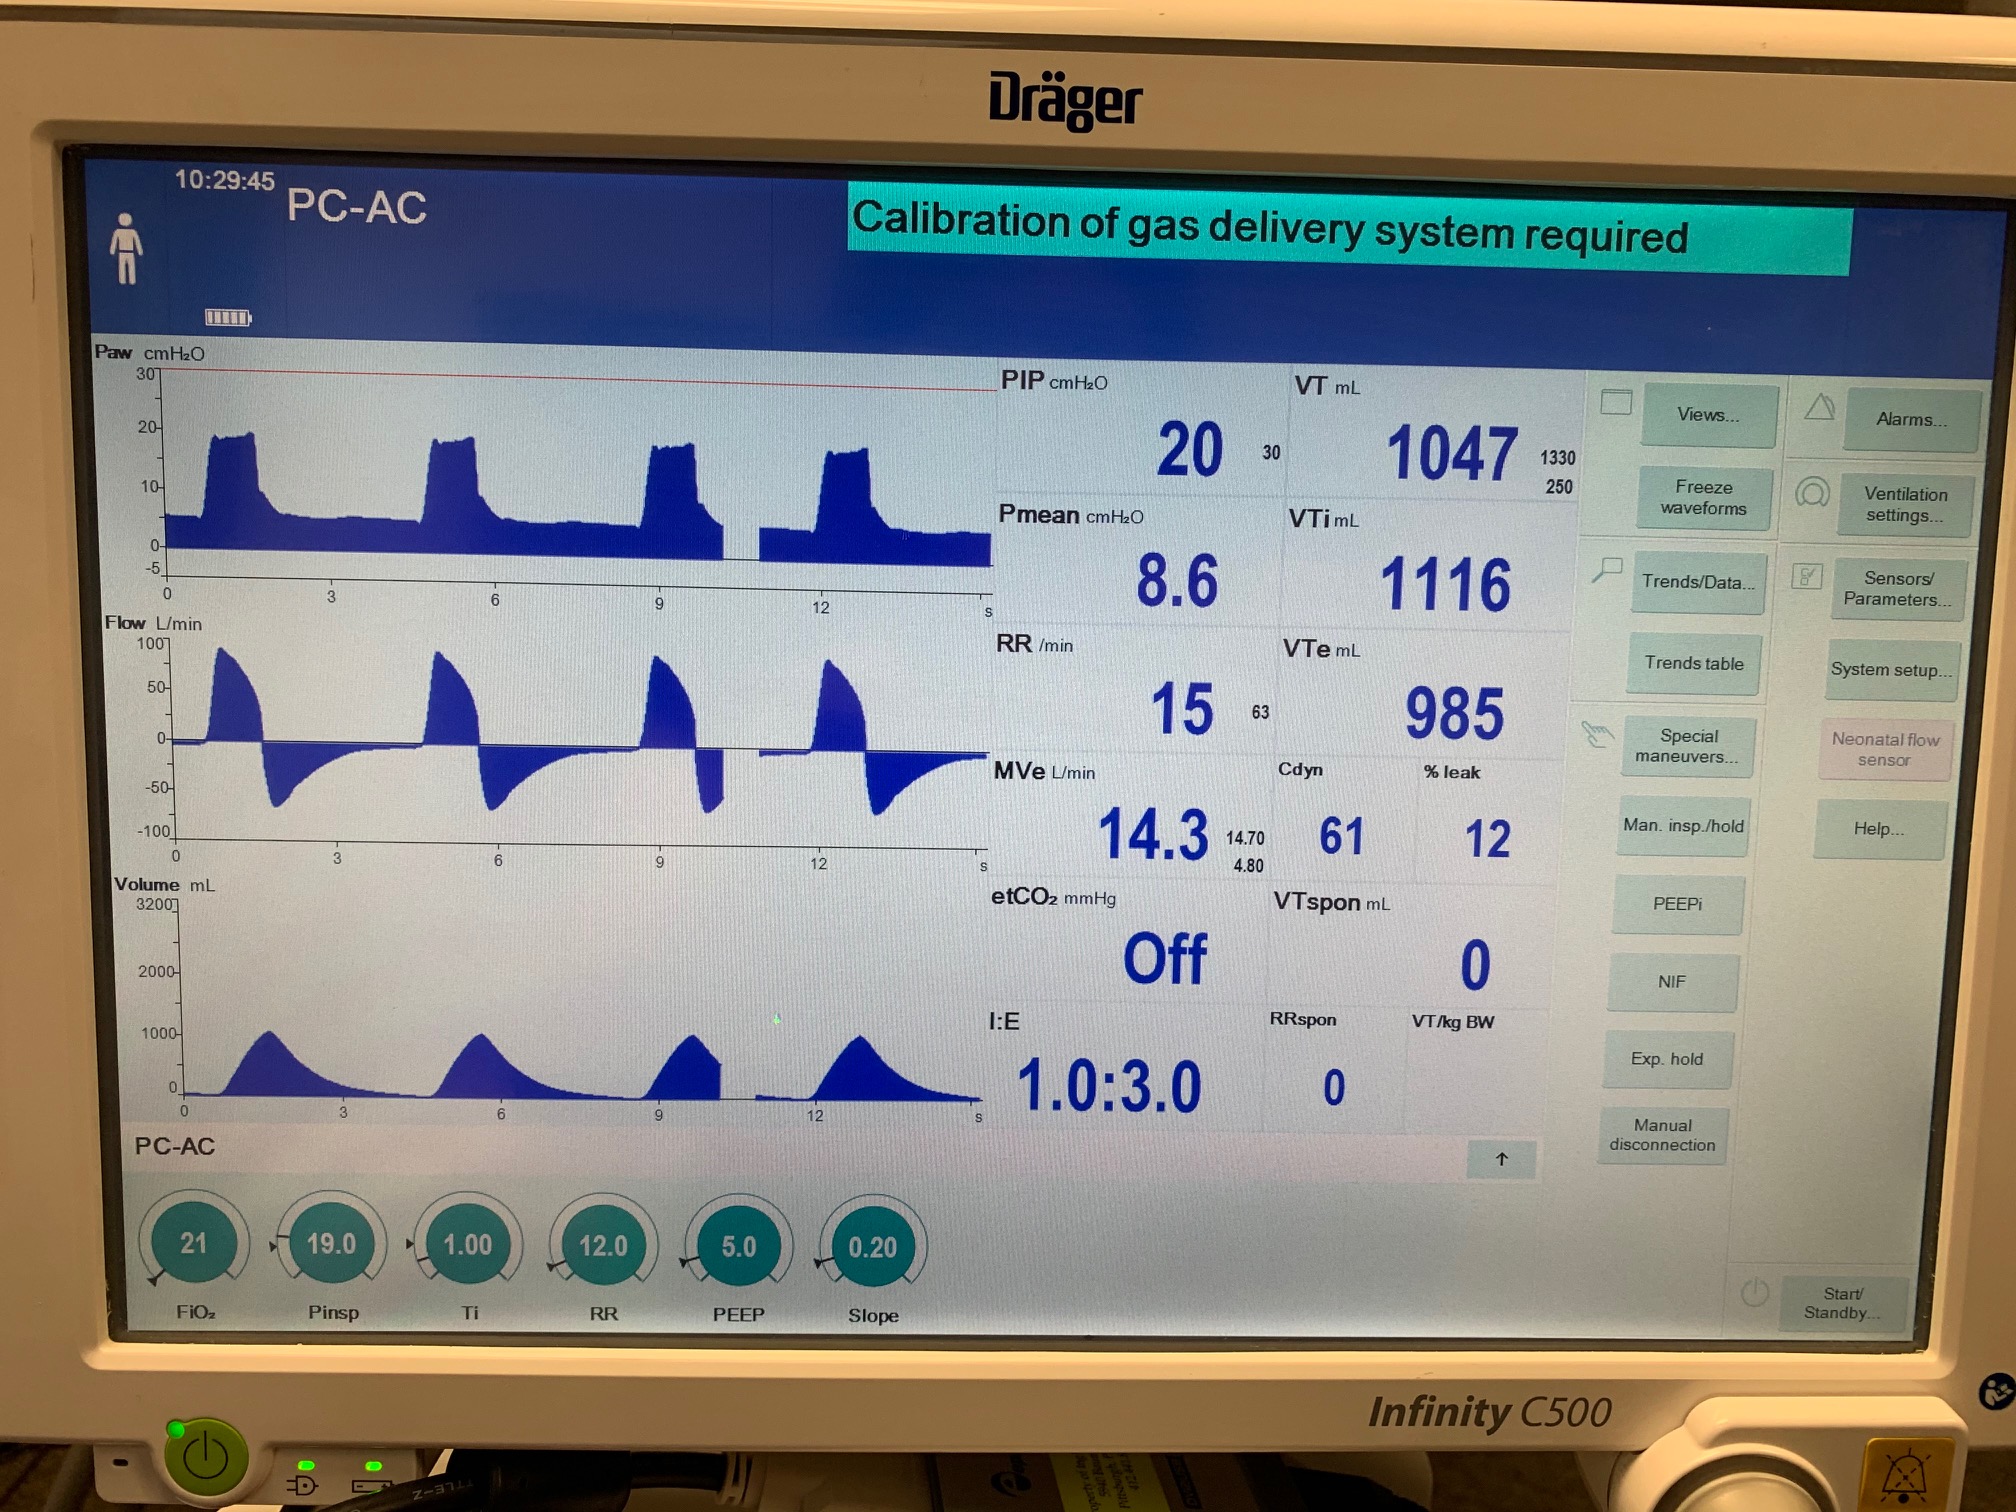
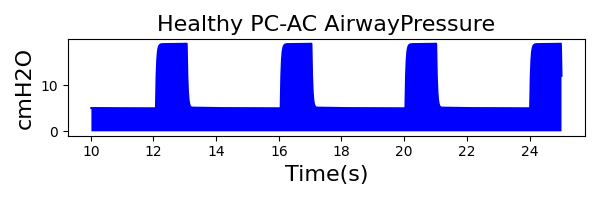
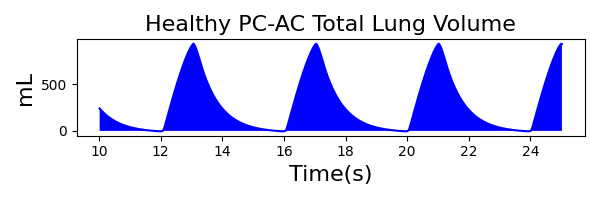
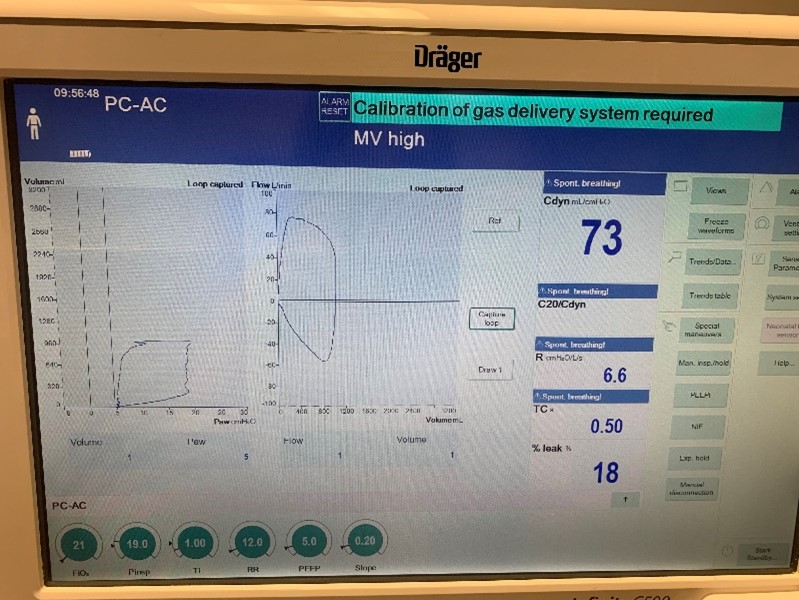
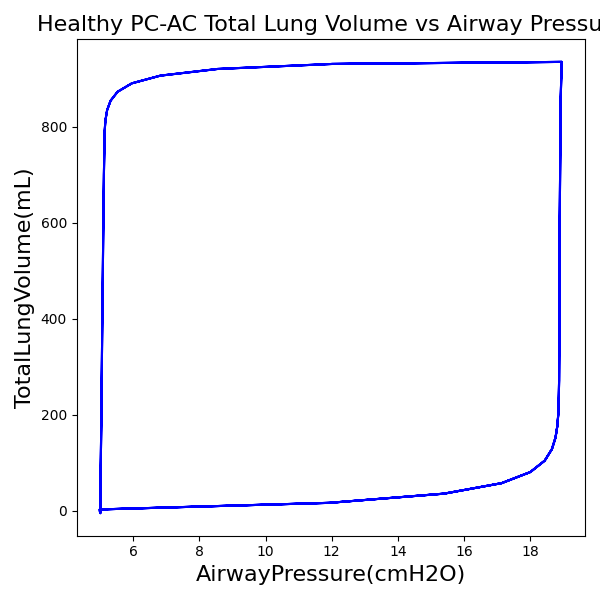
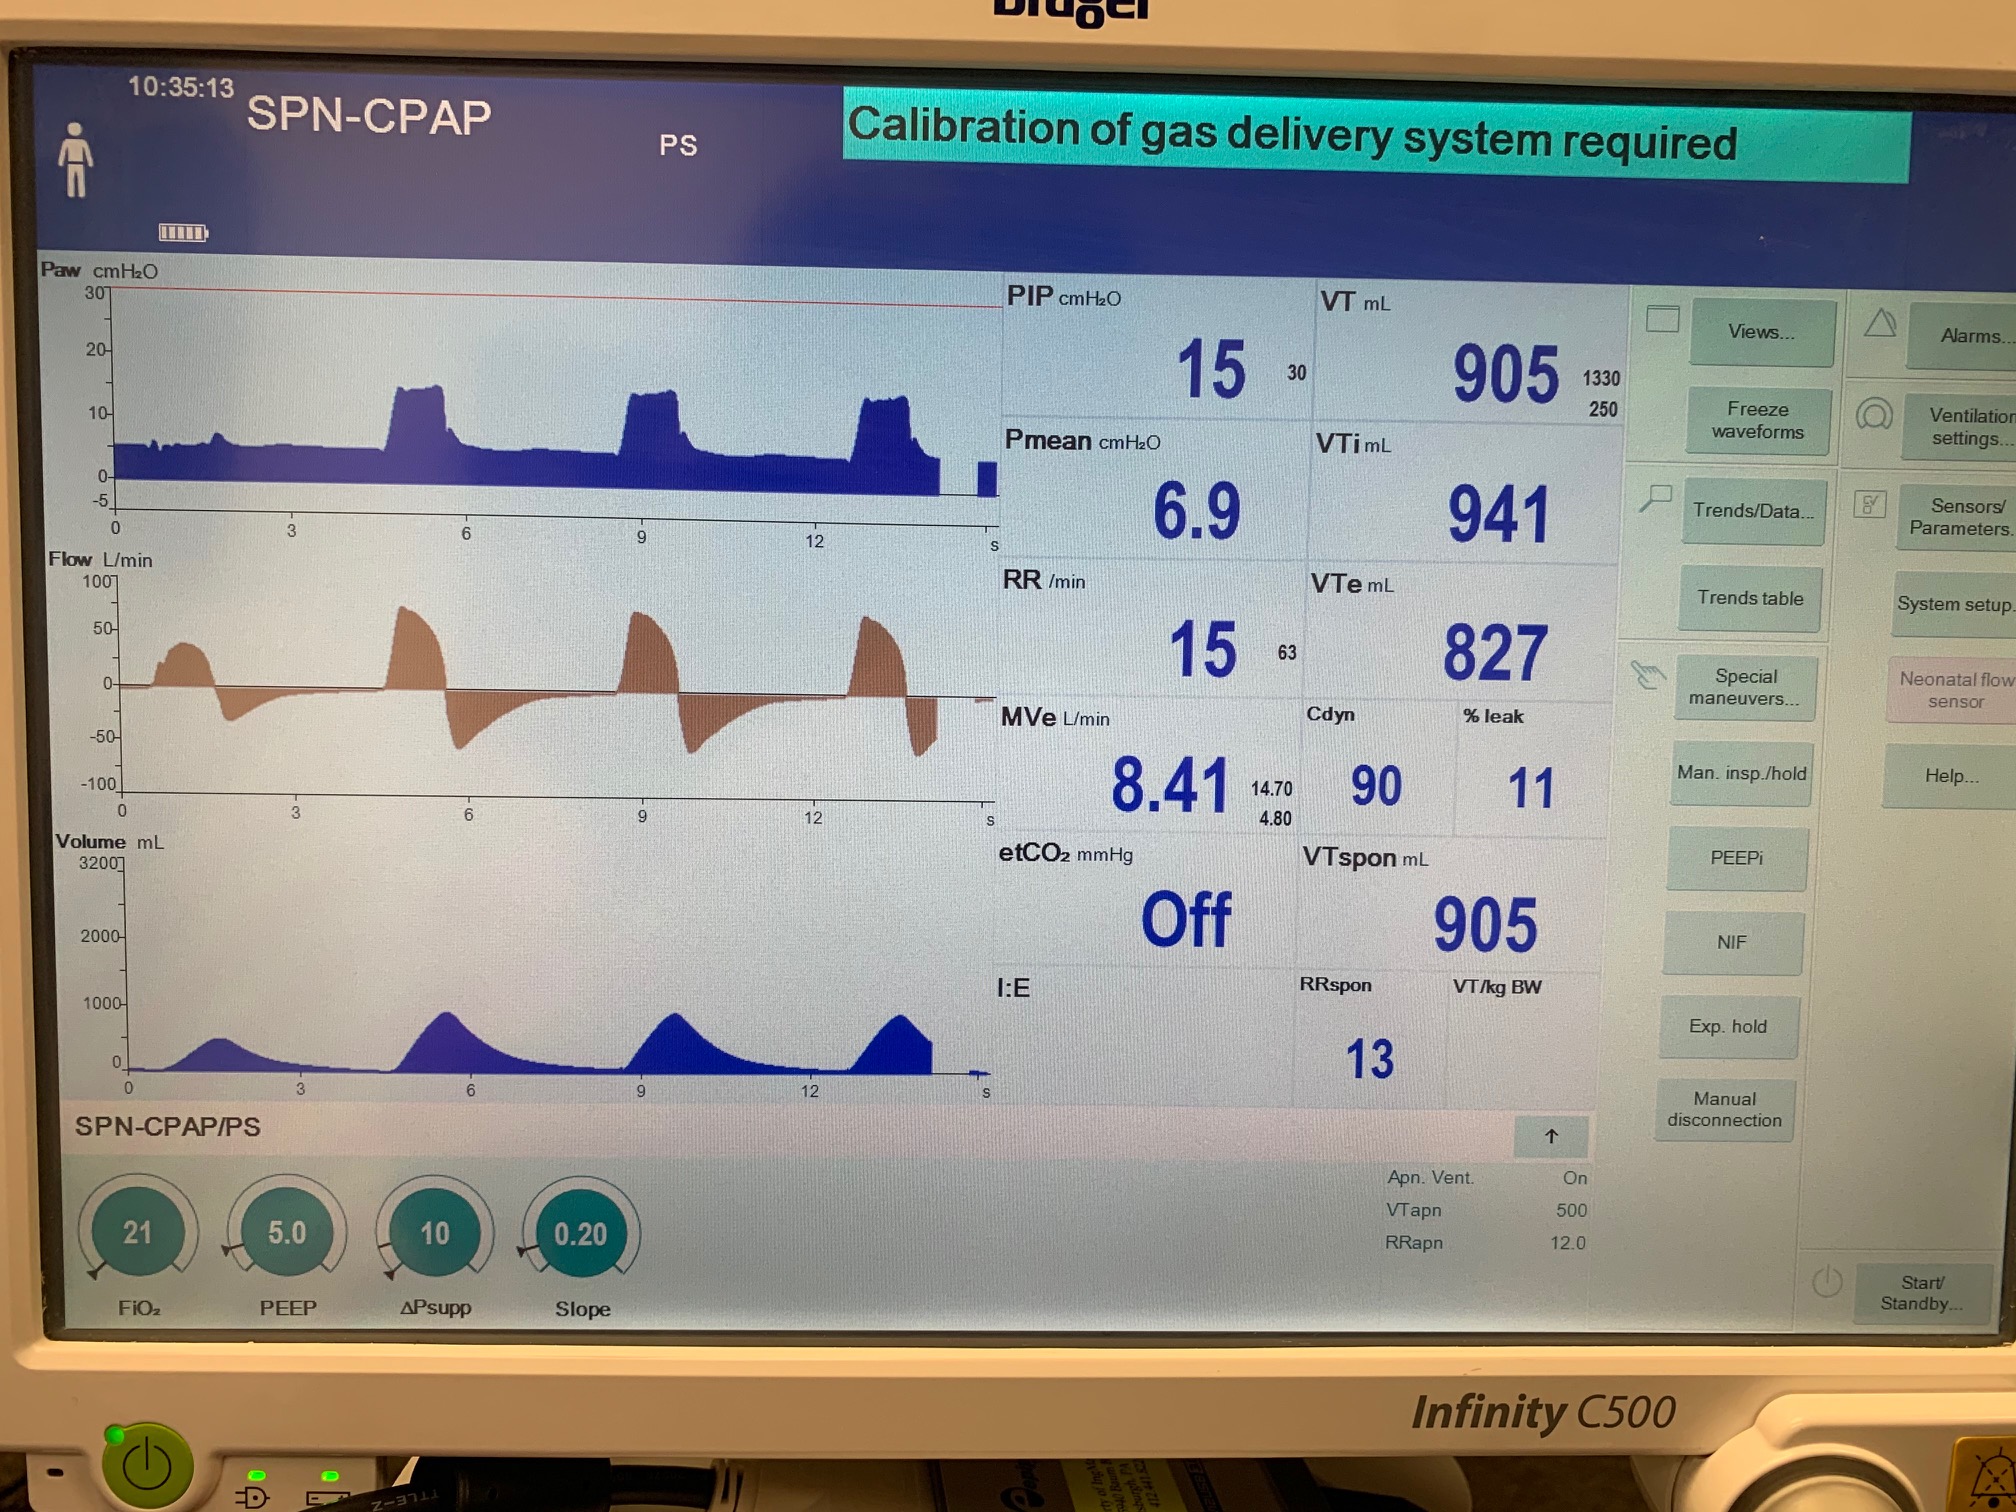
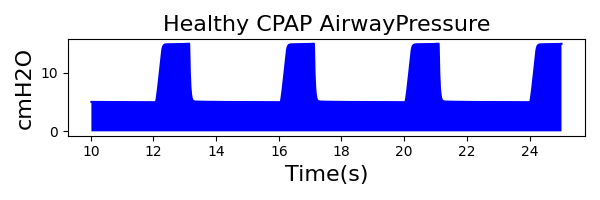
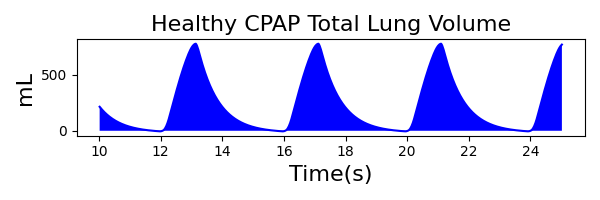
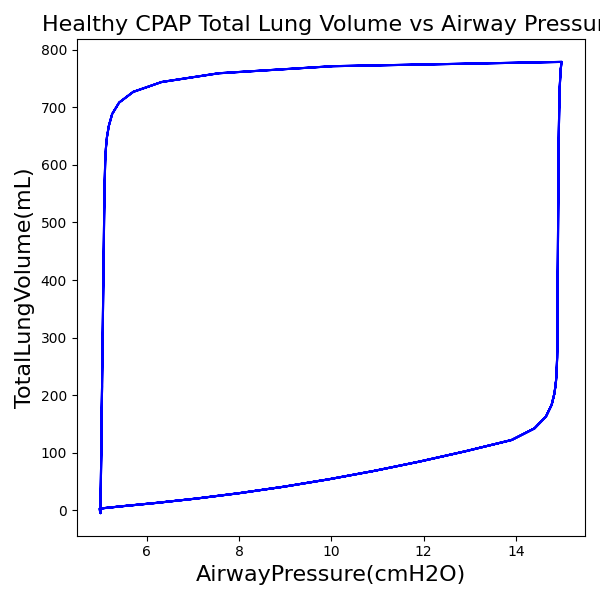
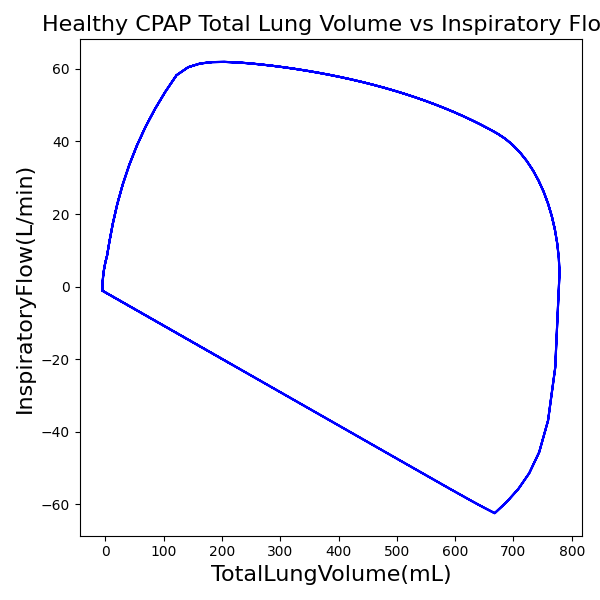
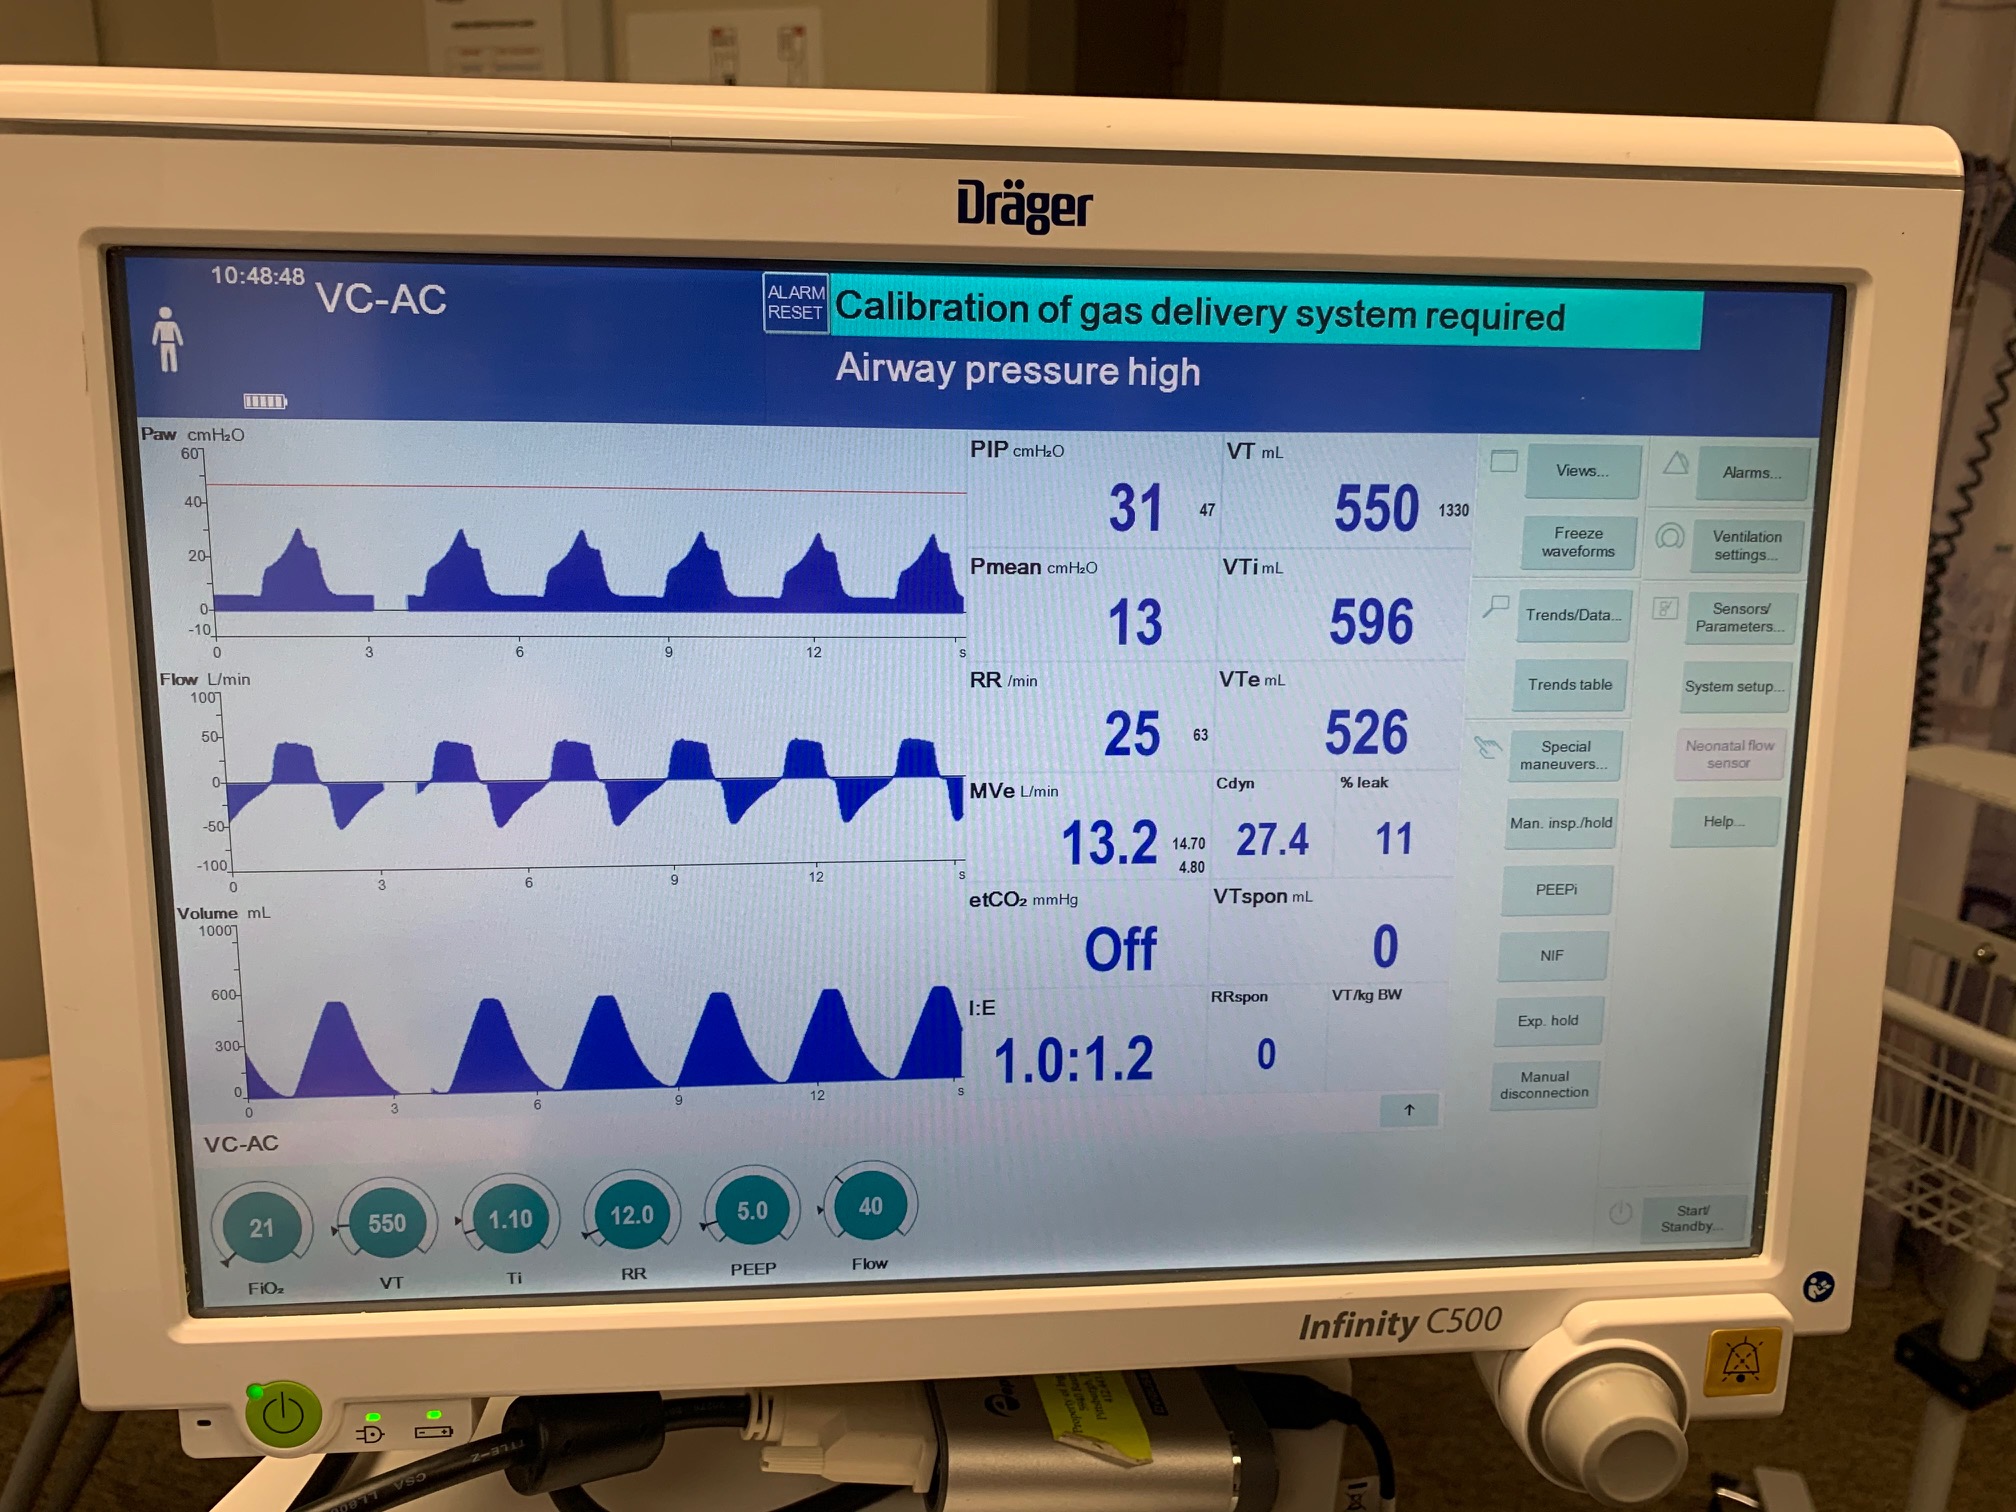
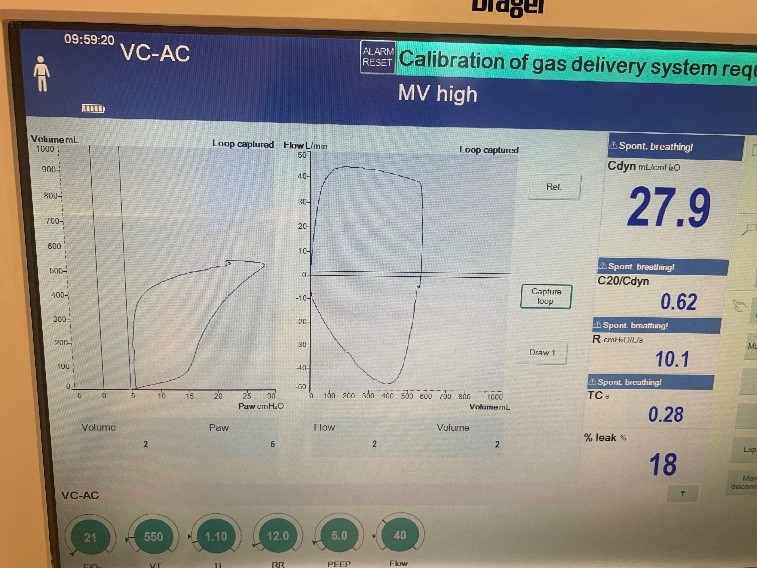
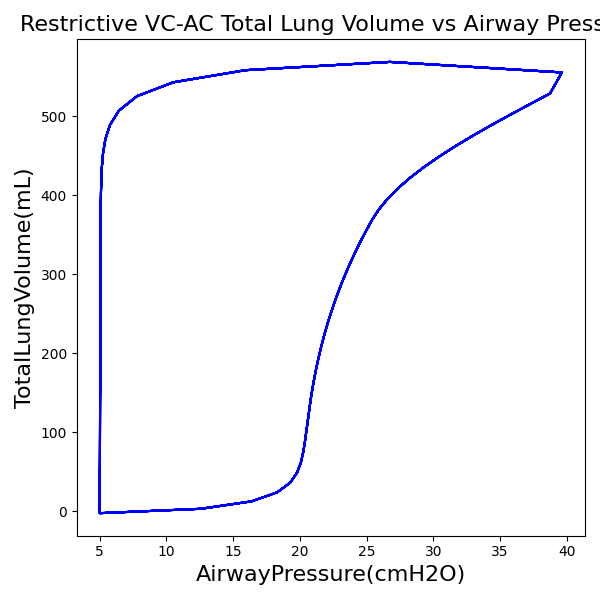
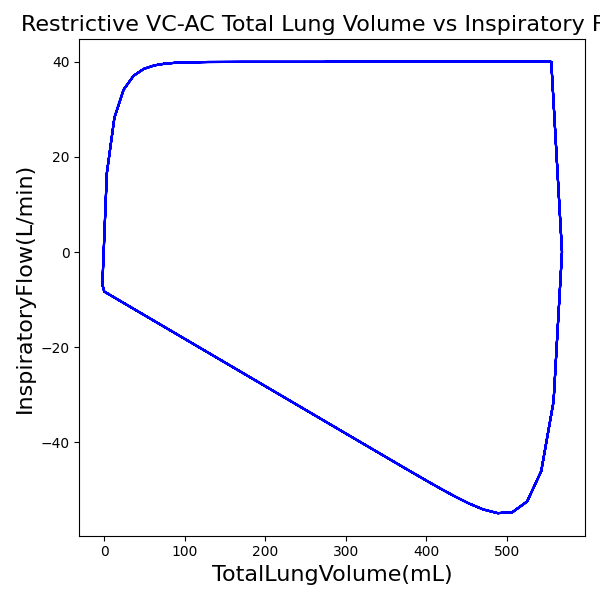
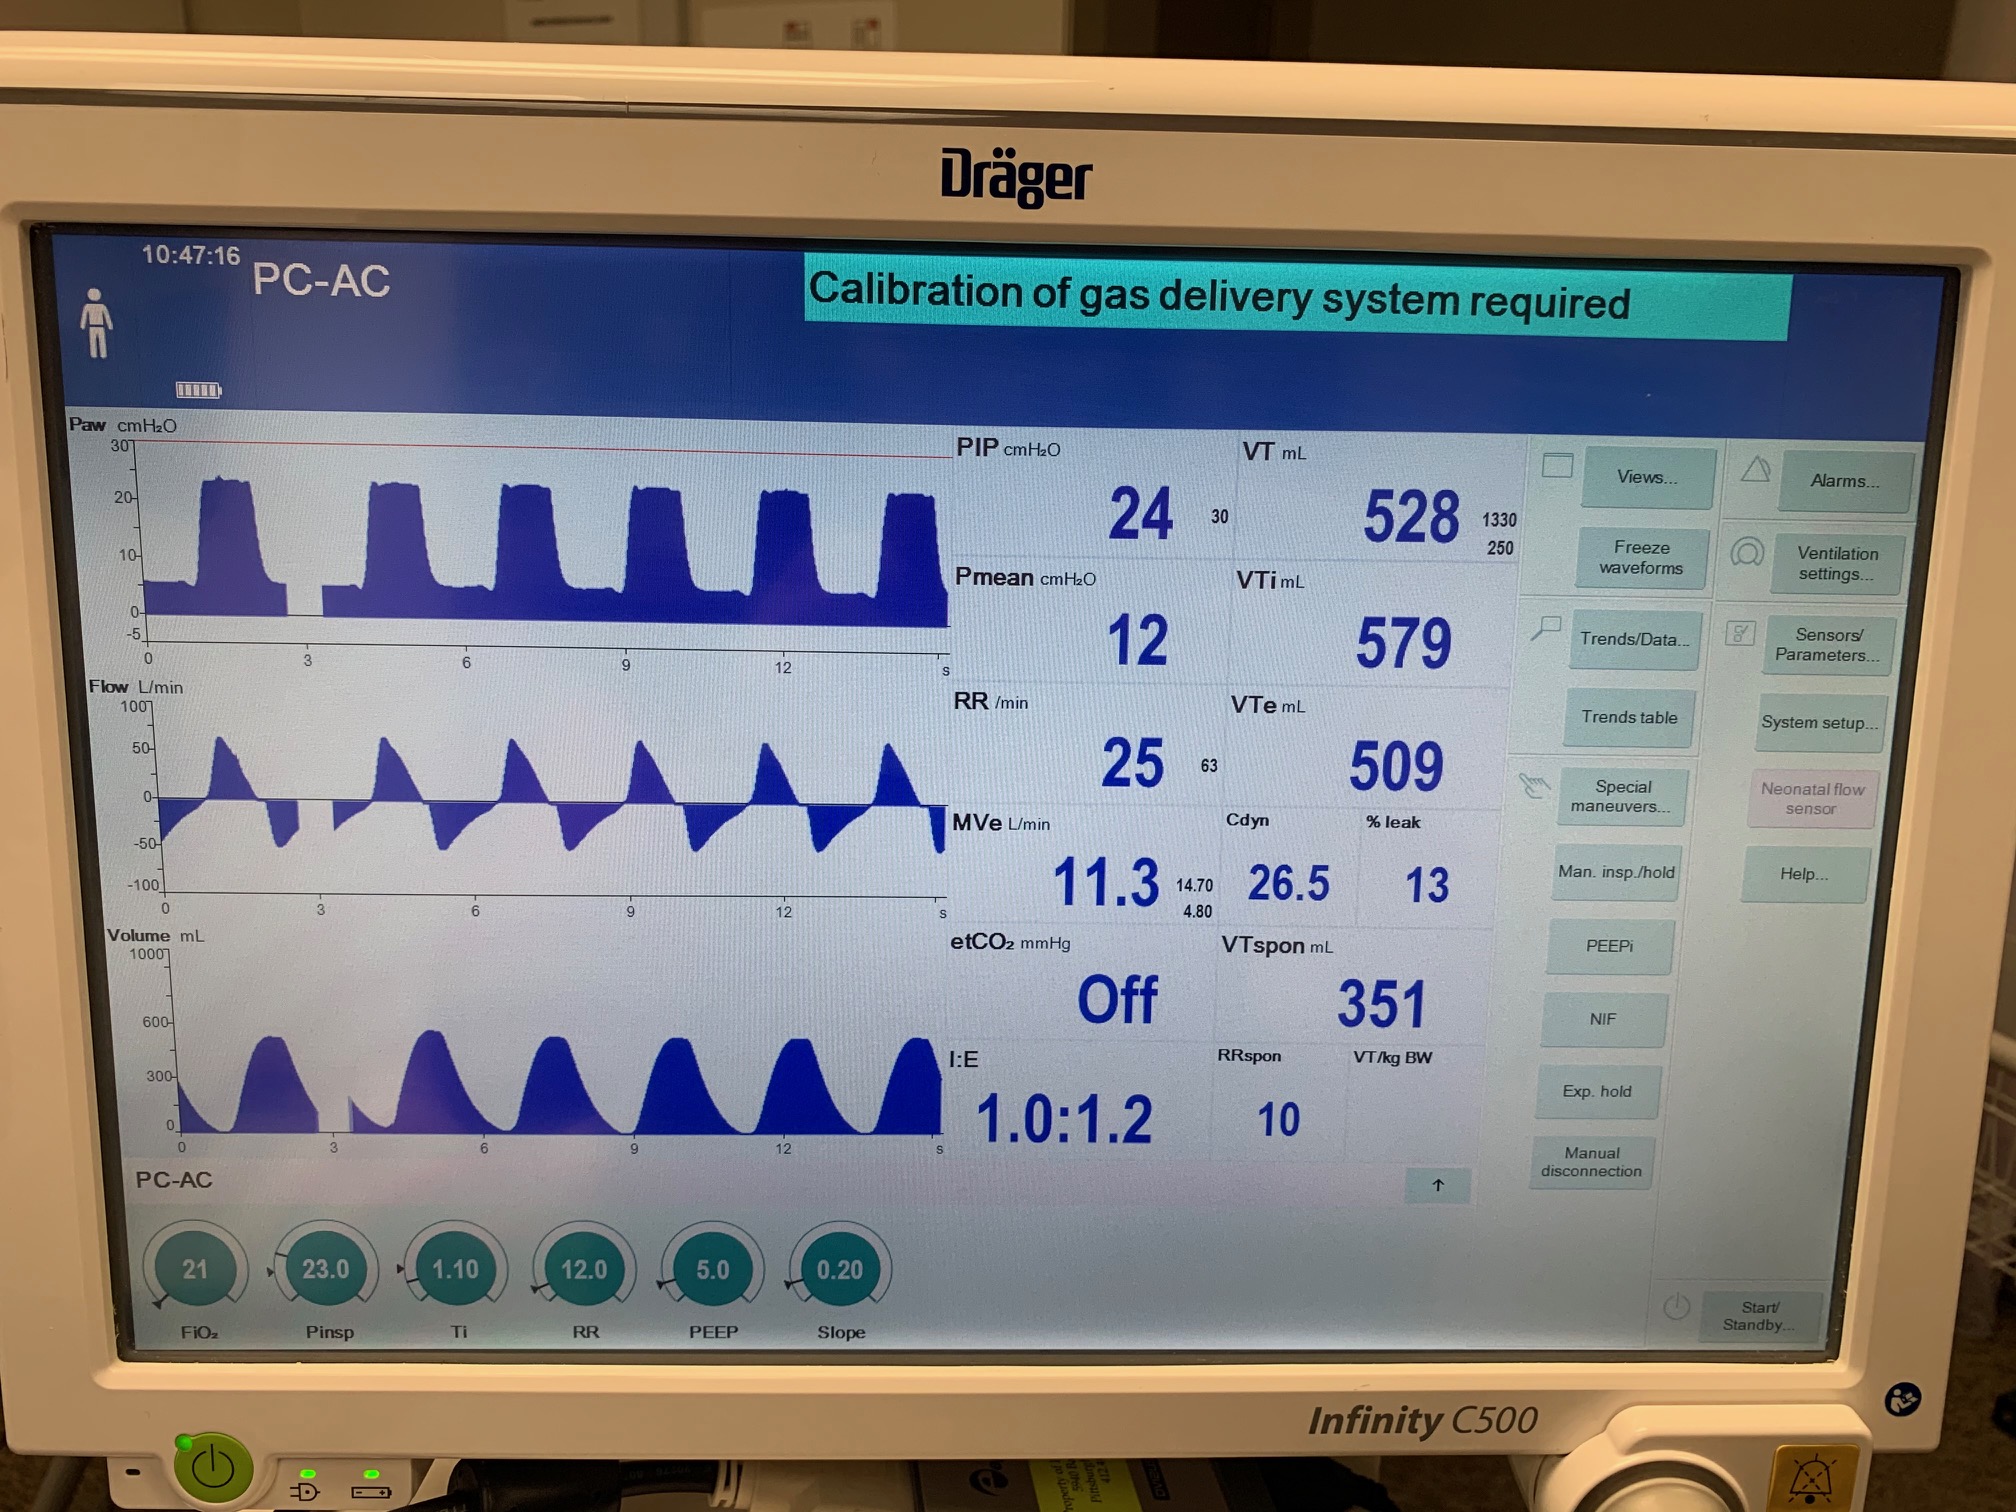
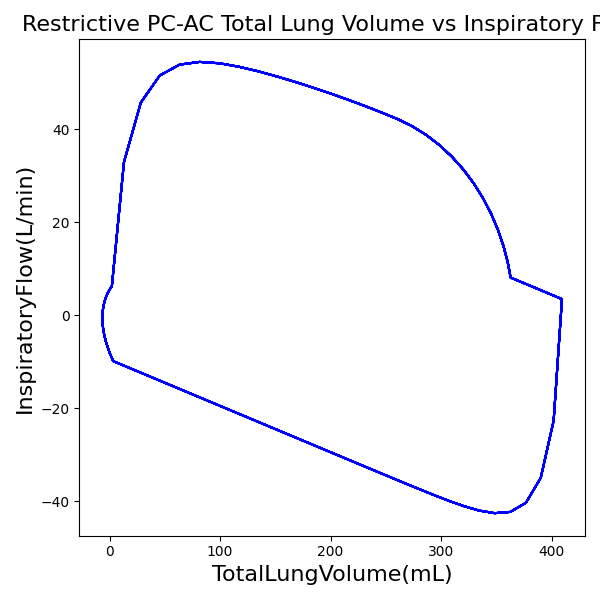
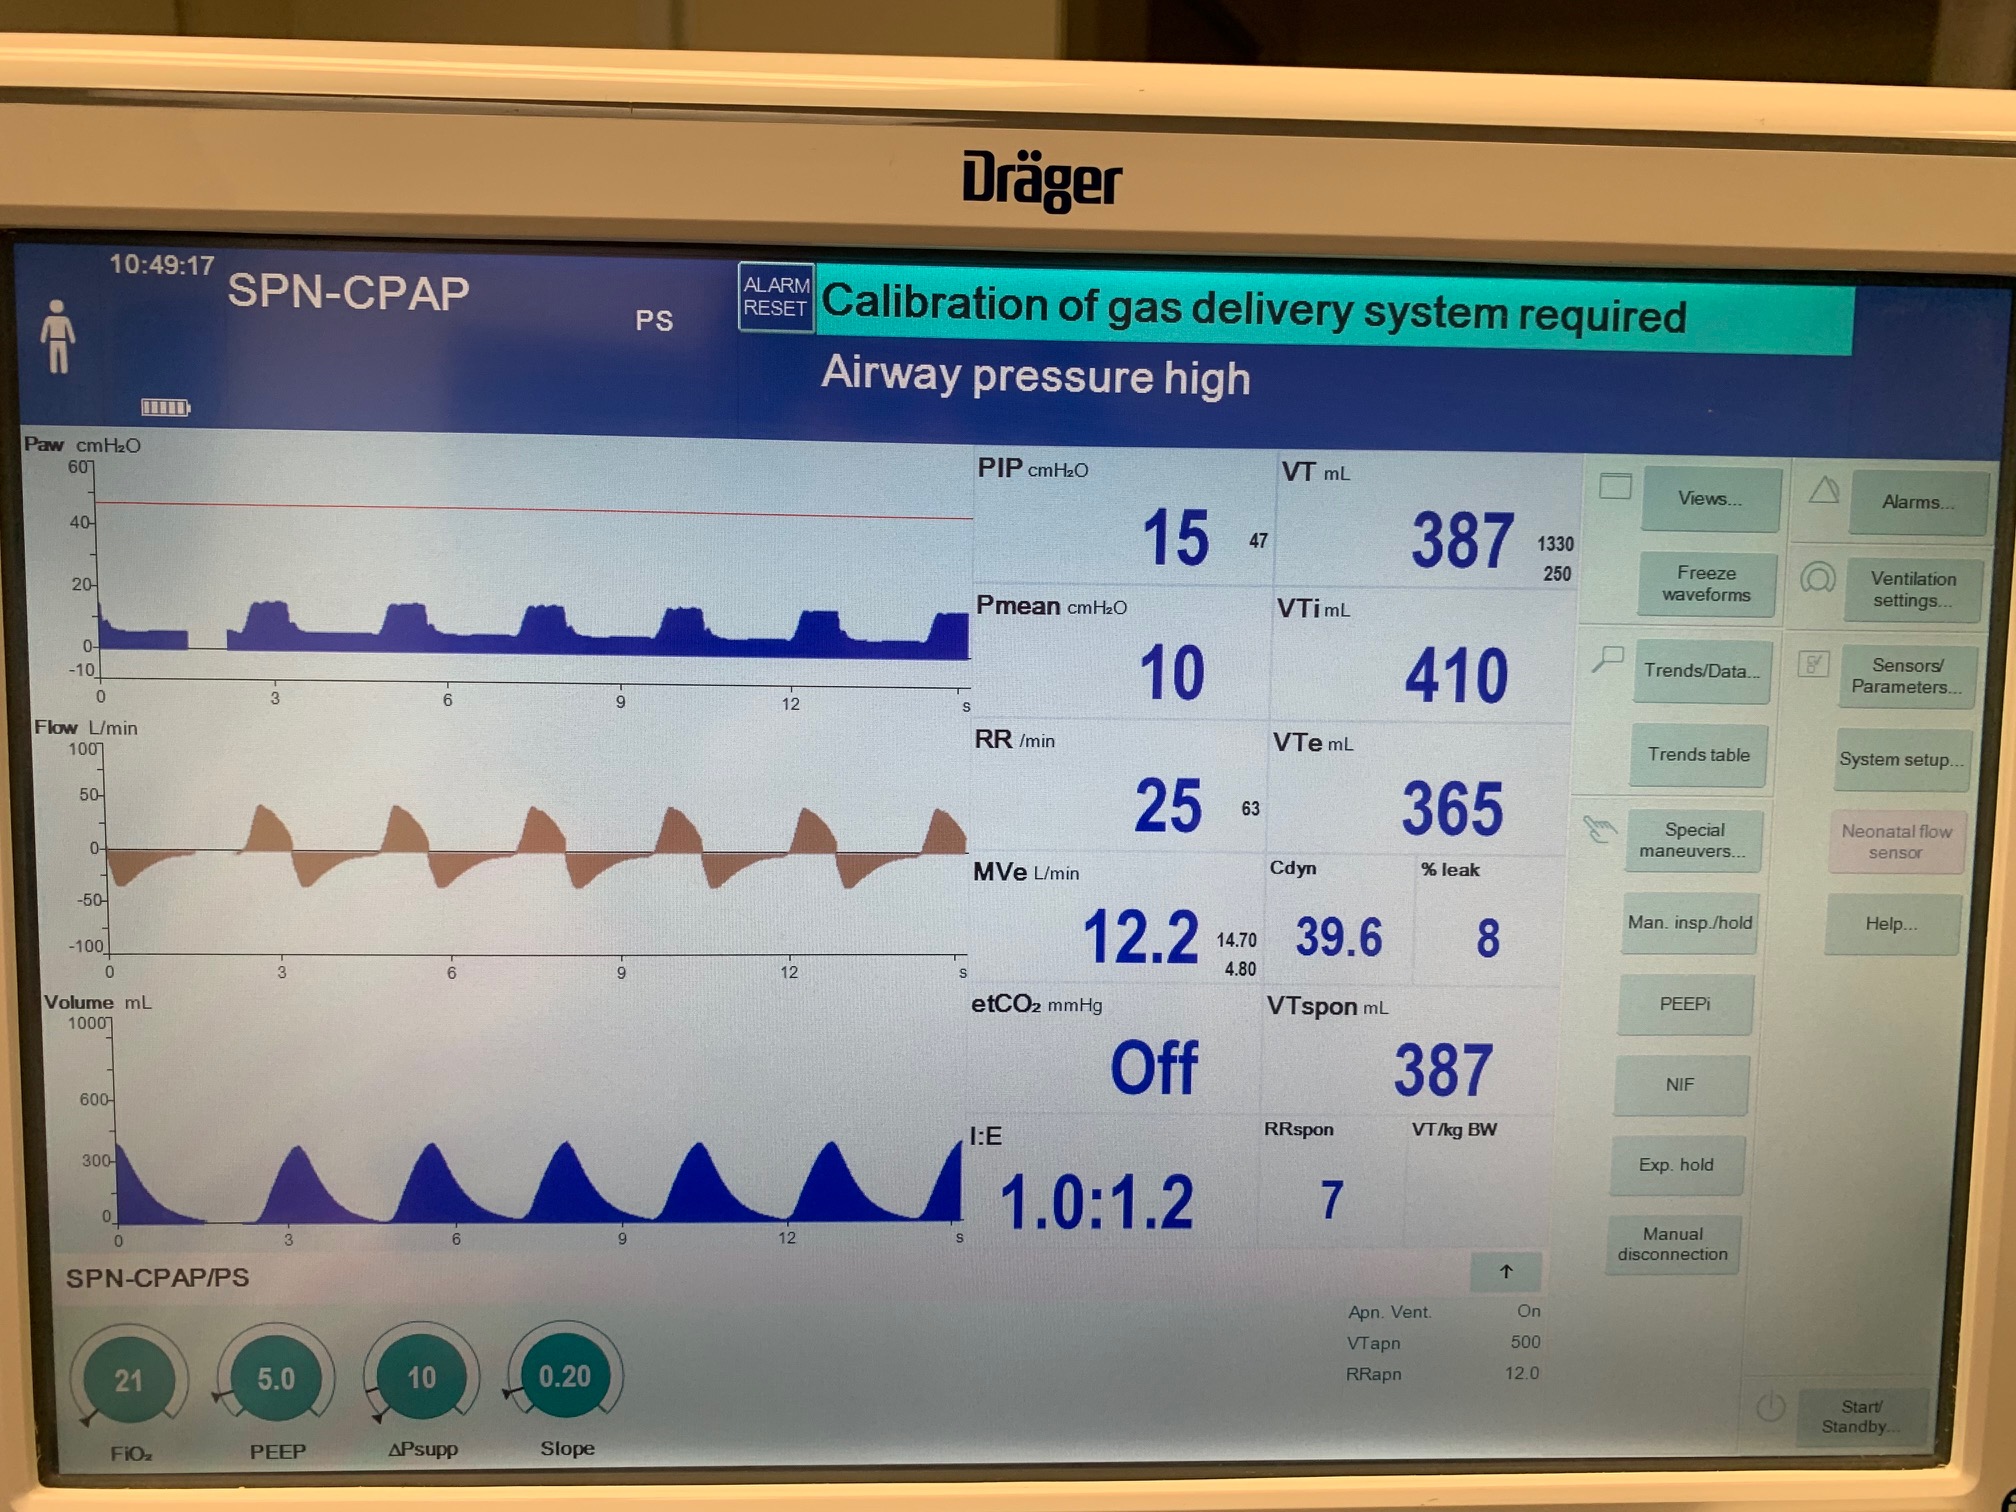
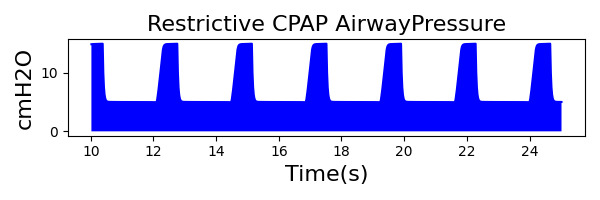
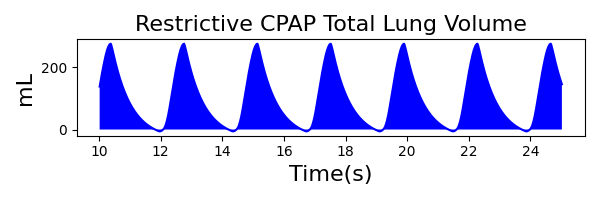
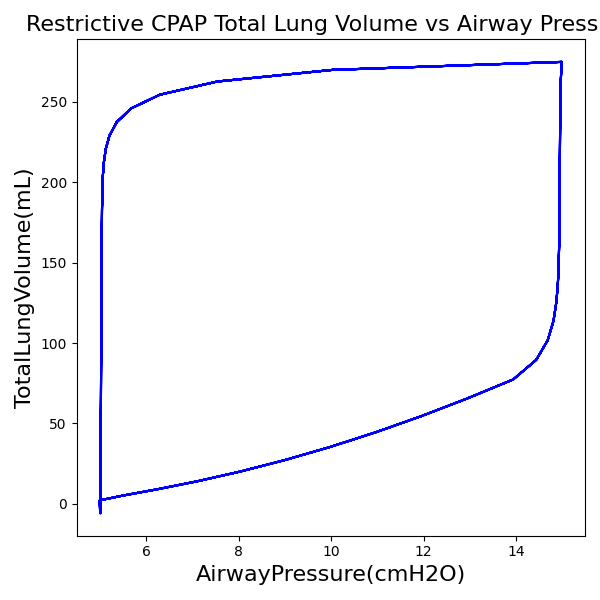
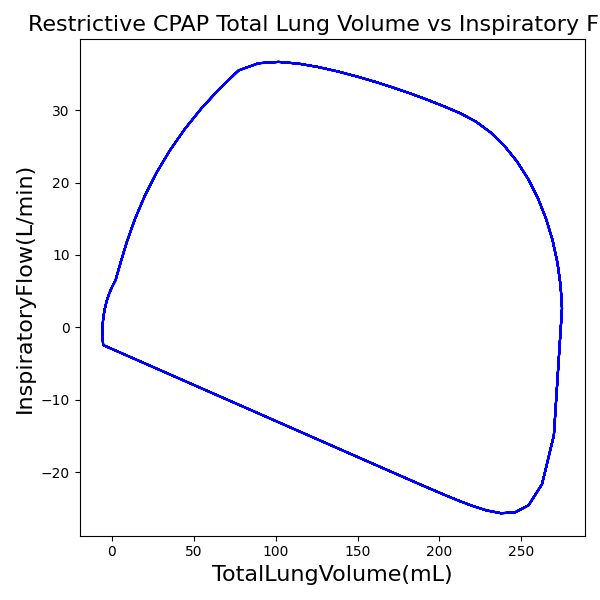
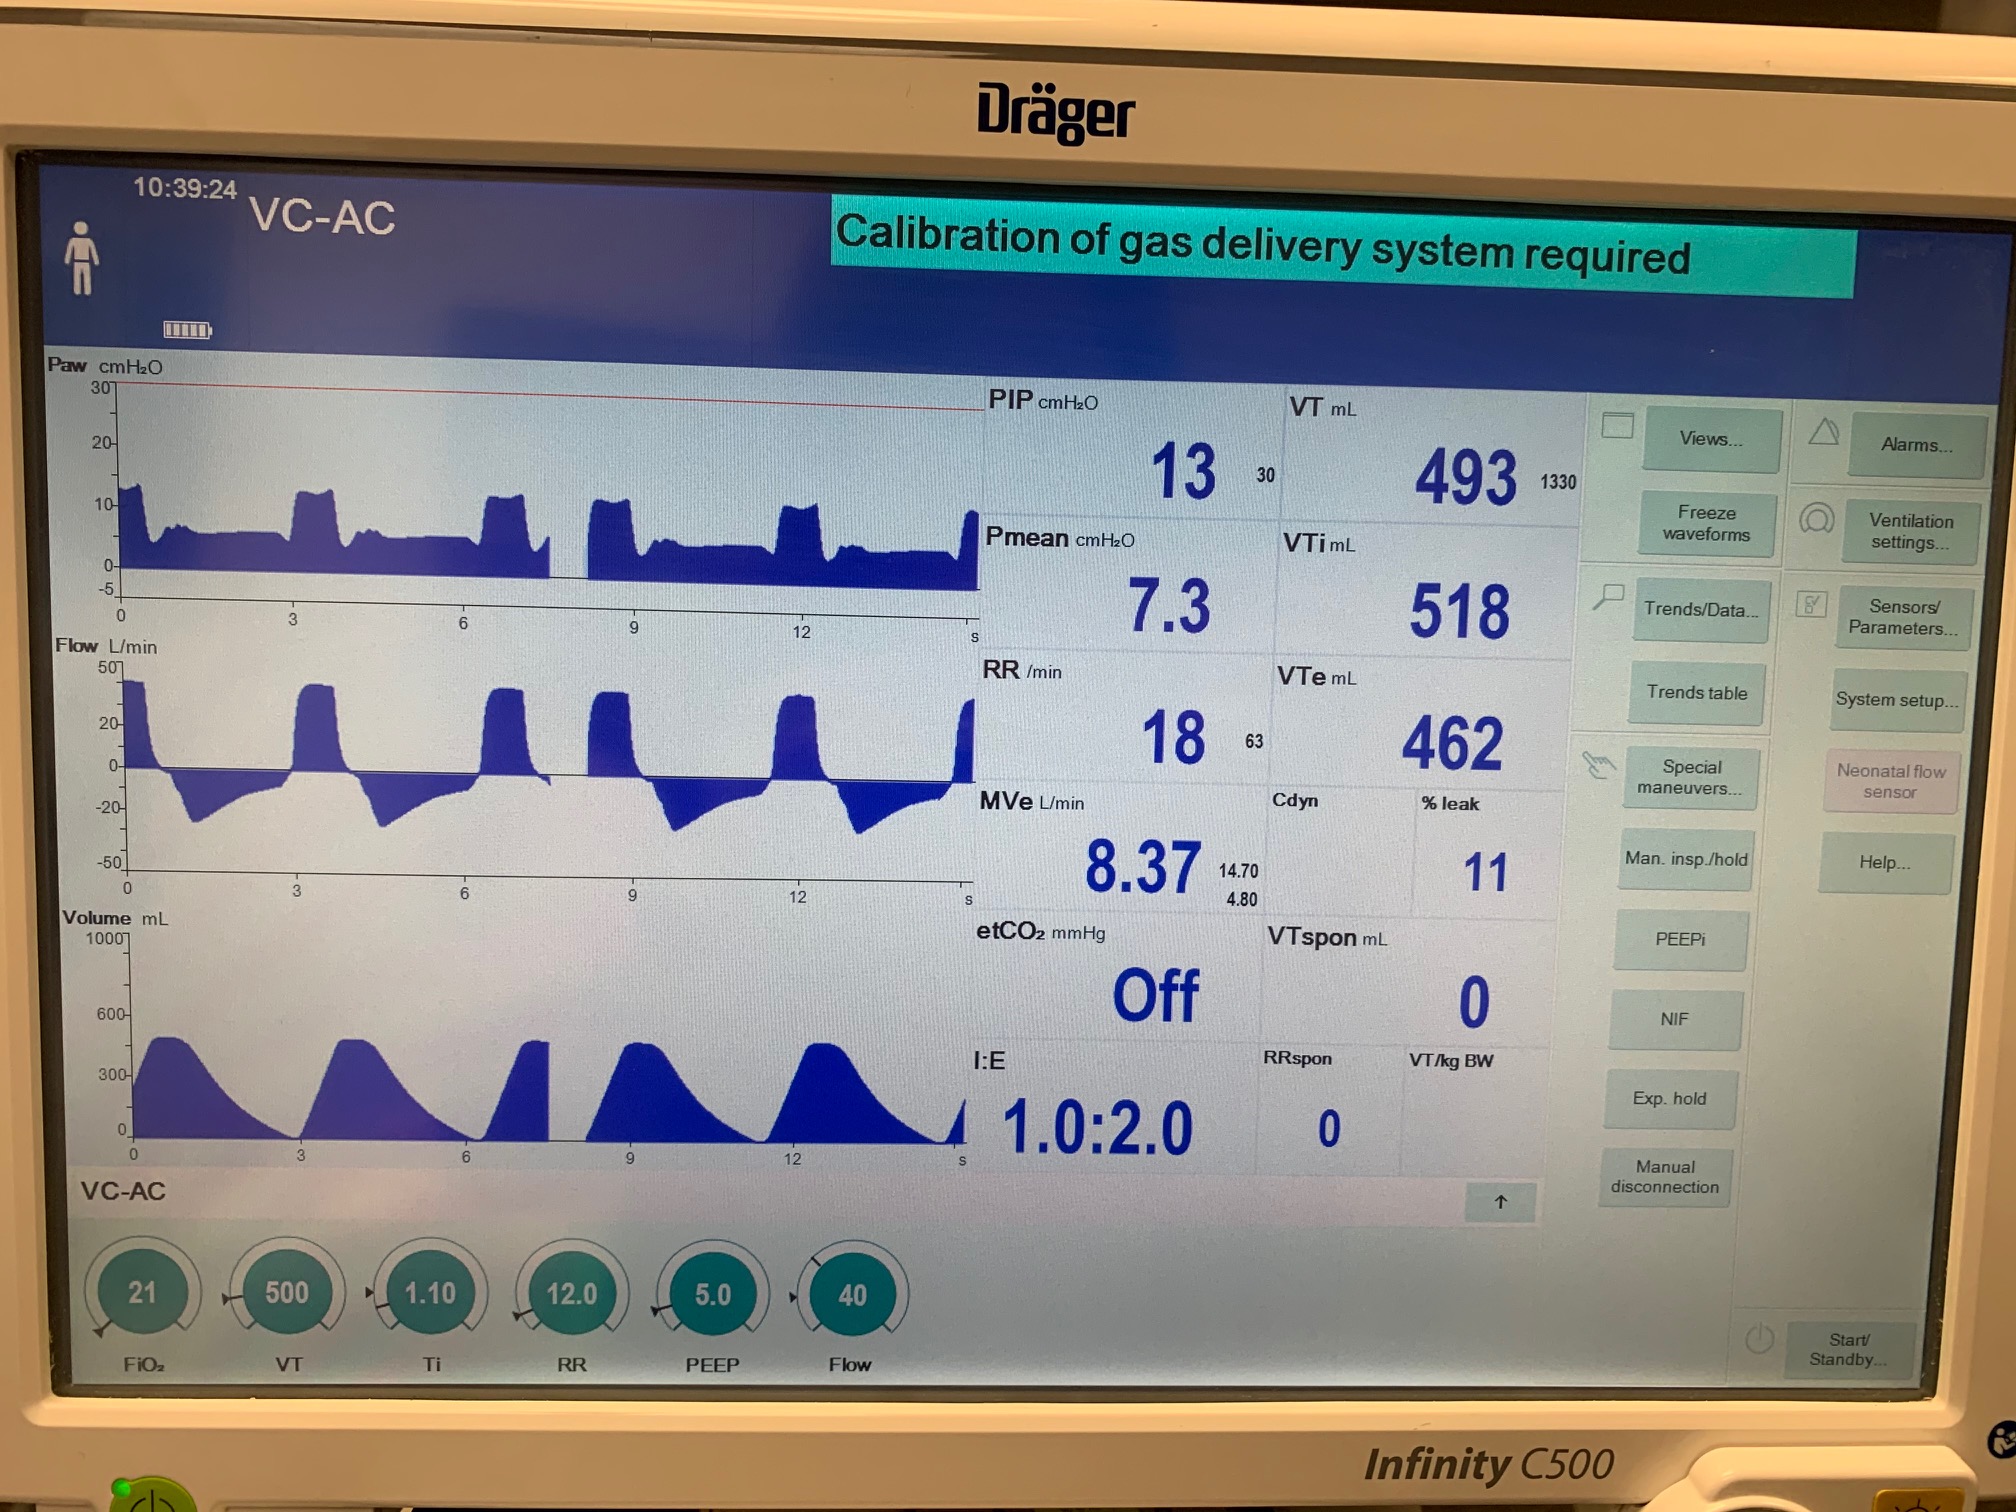
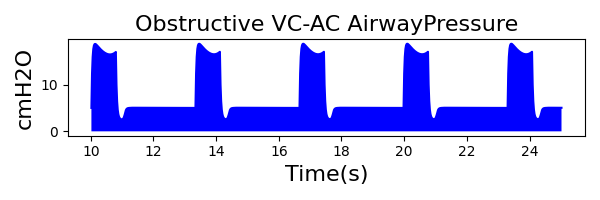
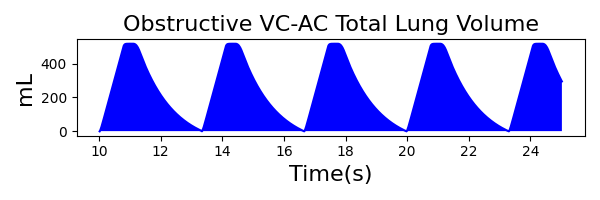
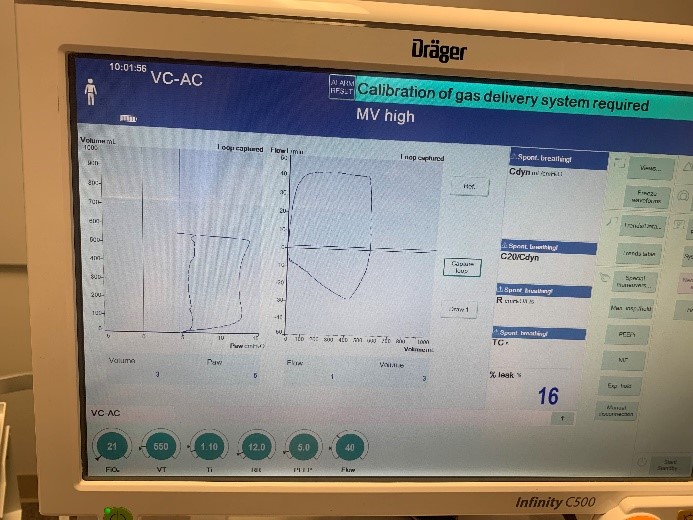
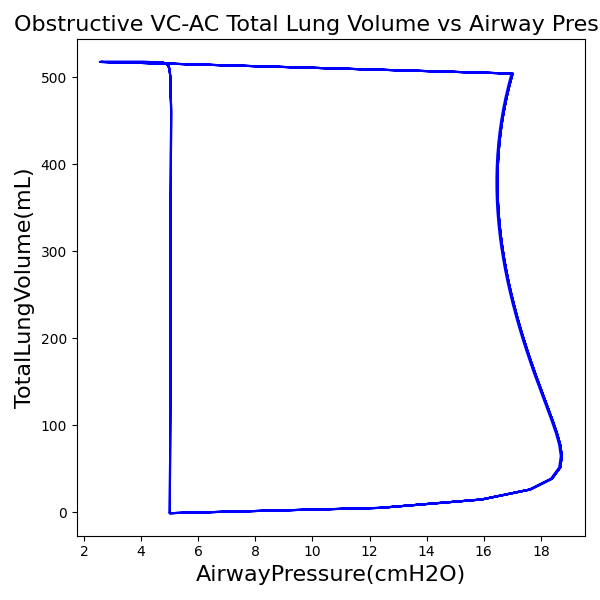
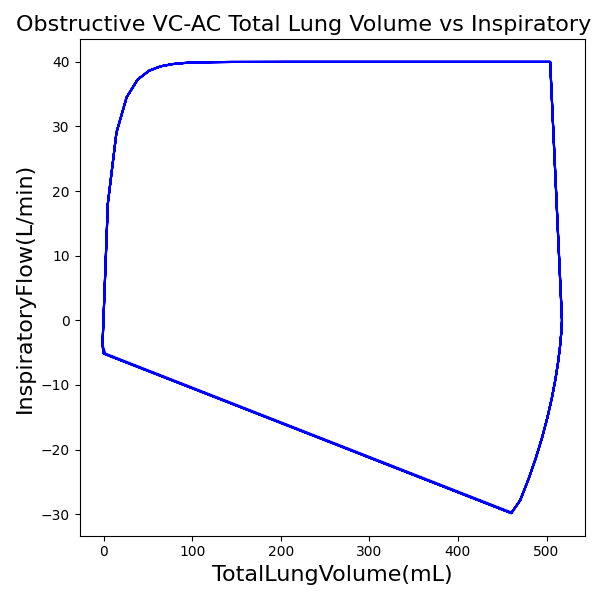
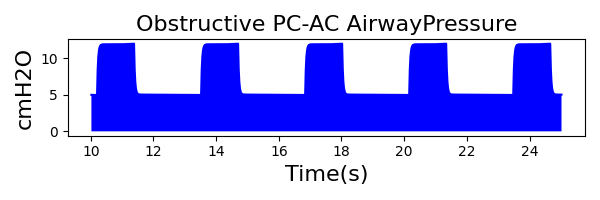
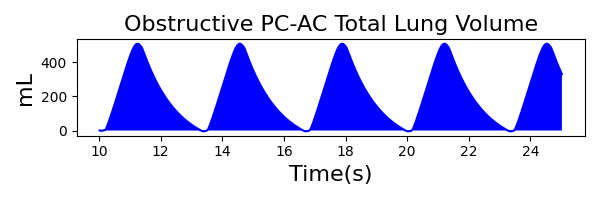
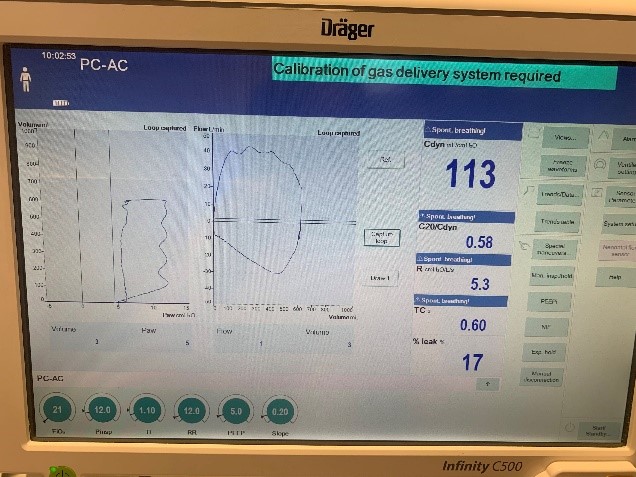
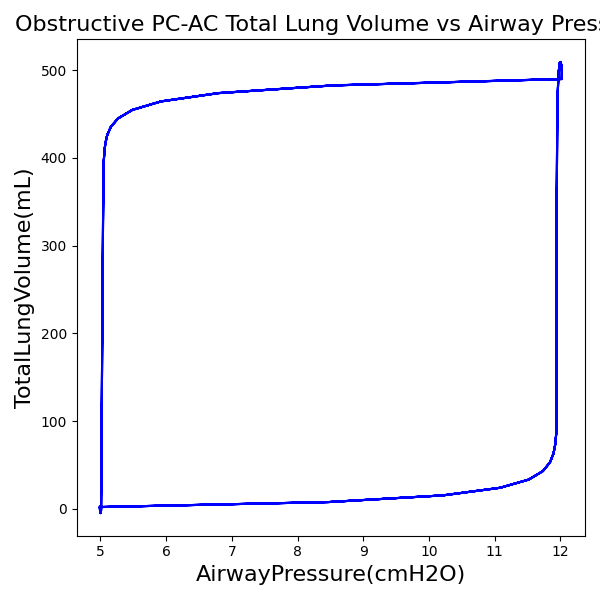
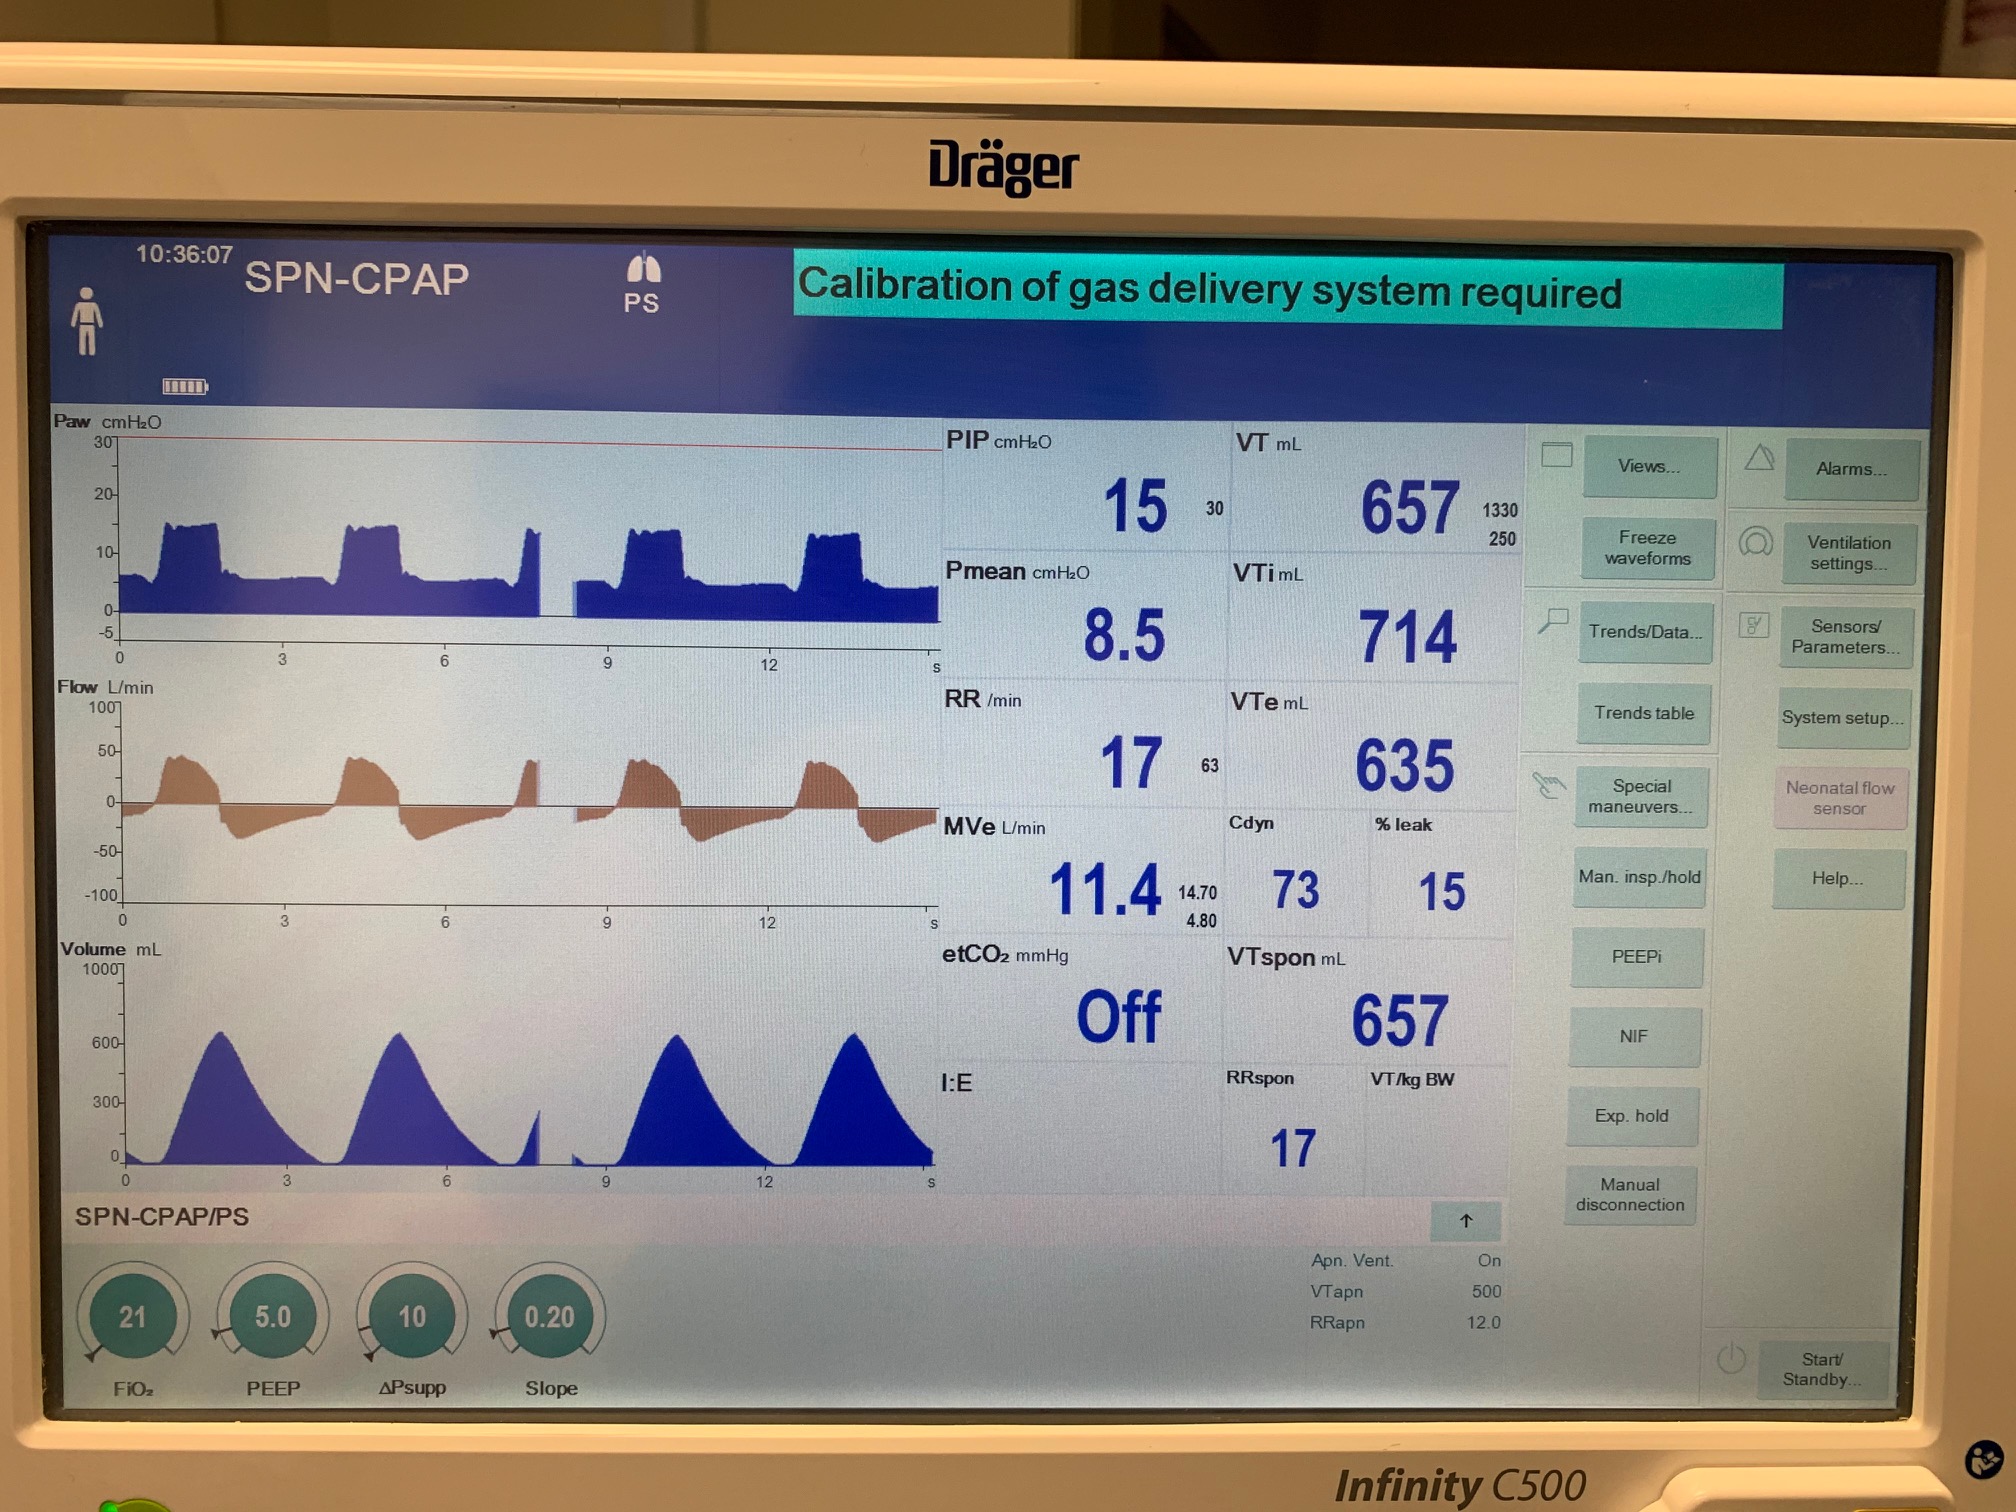
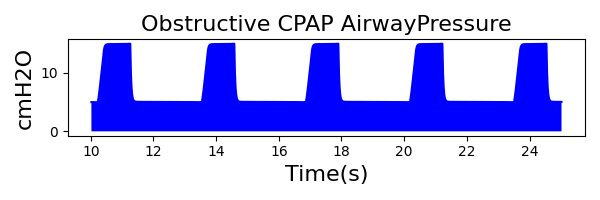
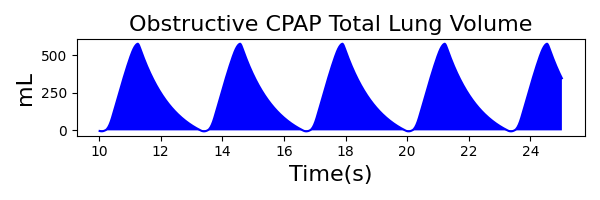
To validate functionality of our virtual ventilator model, we compared Pulse simulation results with physical ventilator values and waveforms. The RespiSim software allowed us to set the ASL 5000 equations of motion patient respiratory parameters (i.e., resistances, compliances, and spontaneous breath waveforms) to the same values as the Pulse respiratory system. The same ventilator settings were also applied to the physical Drager ventilator and the Pulse virtual ventilator model. We were able to create scenarios of spontaneously breathing patients with healthy lungs, restrictive disease, and obstructive disease in combination with PC-AC, VC-AC, and CPAP modes, for nine total validation use cases.
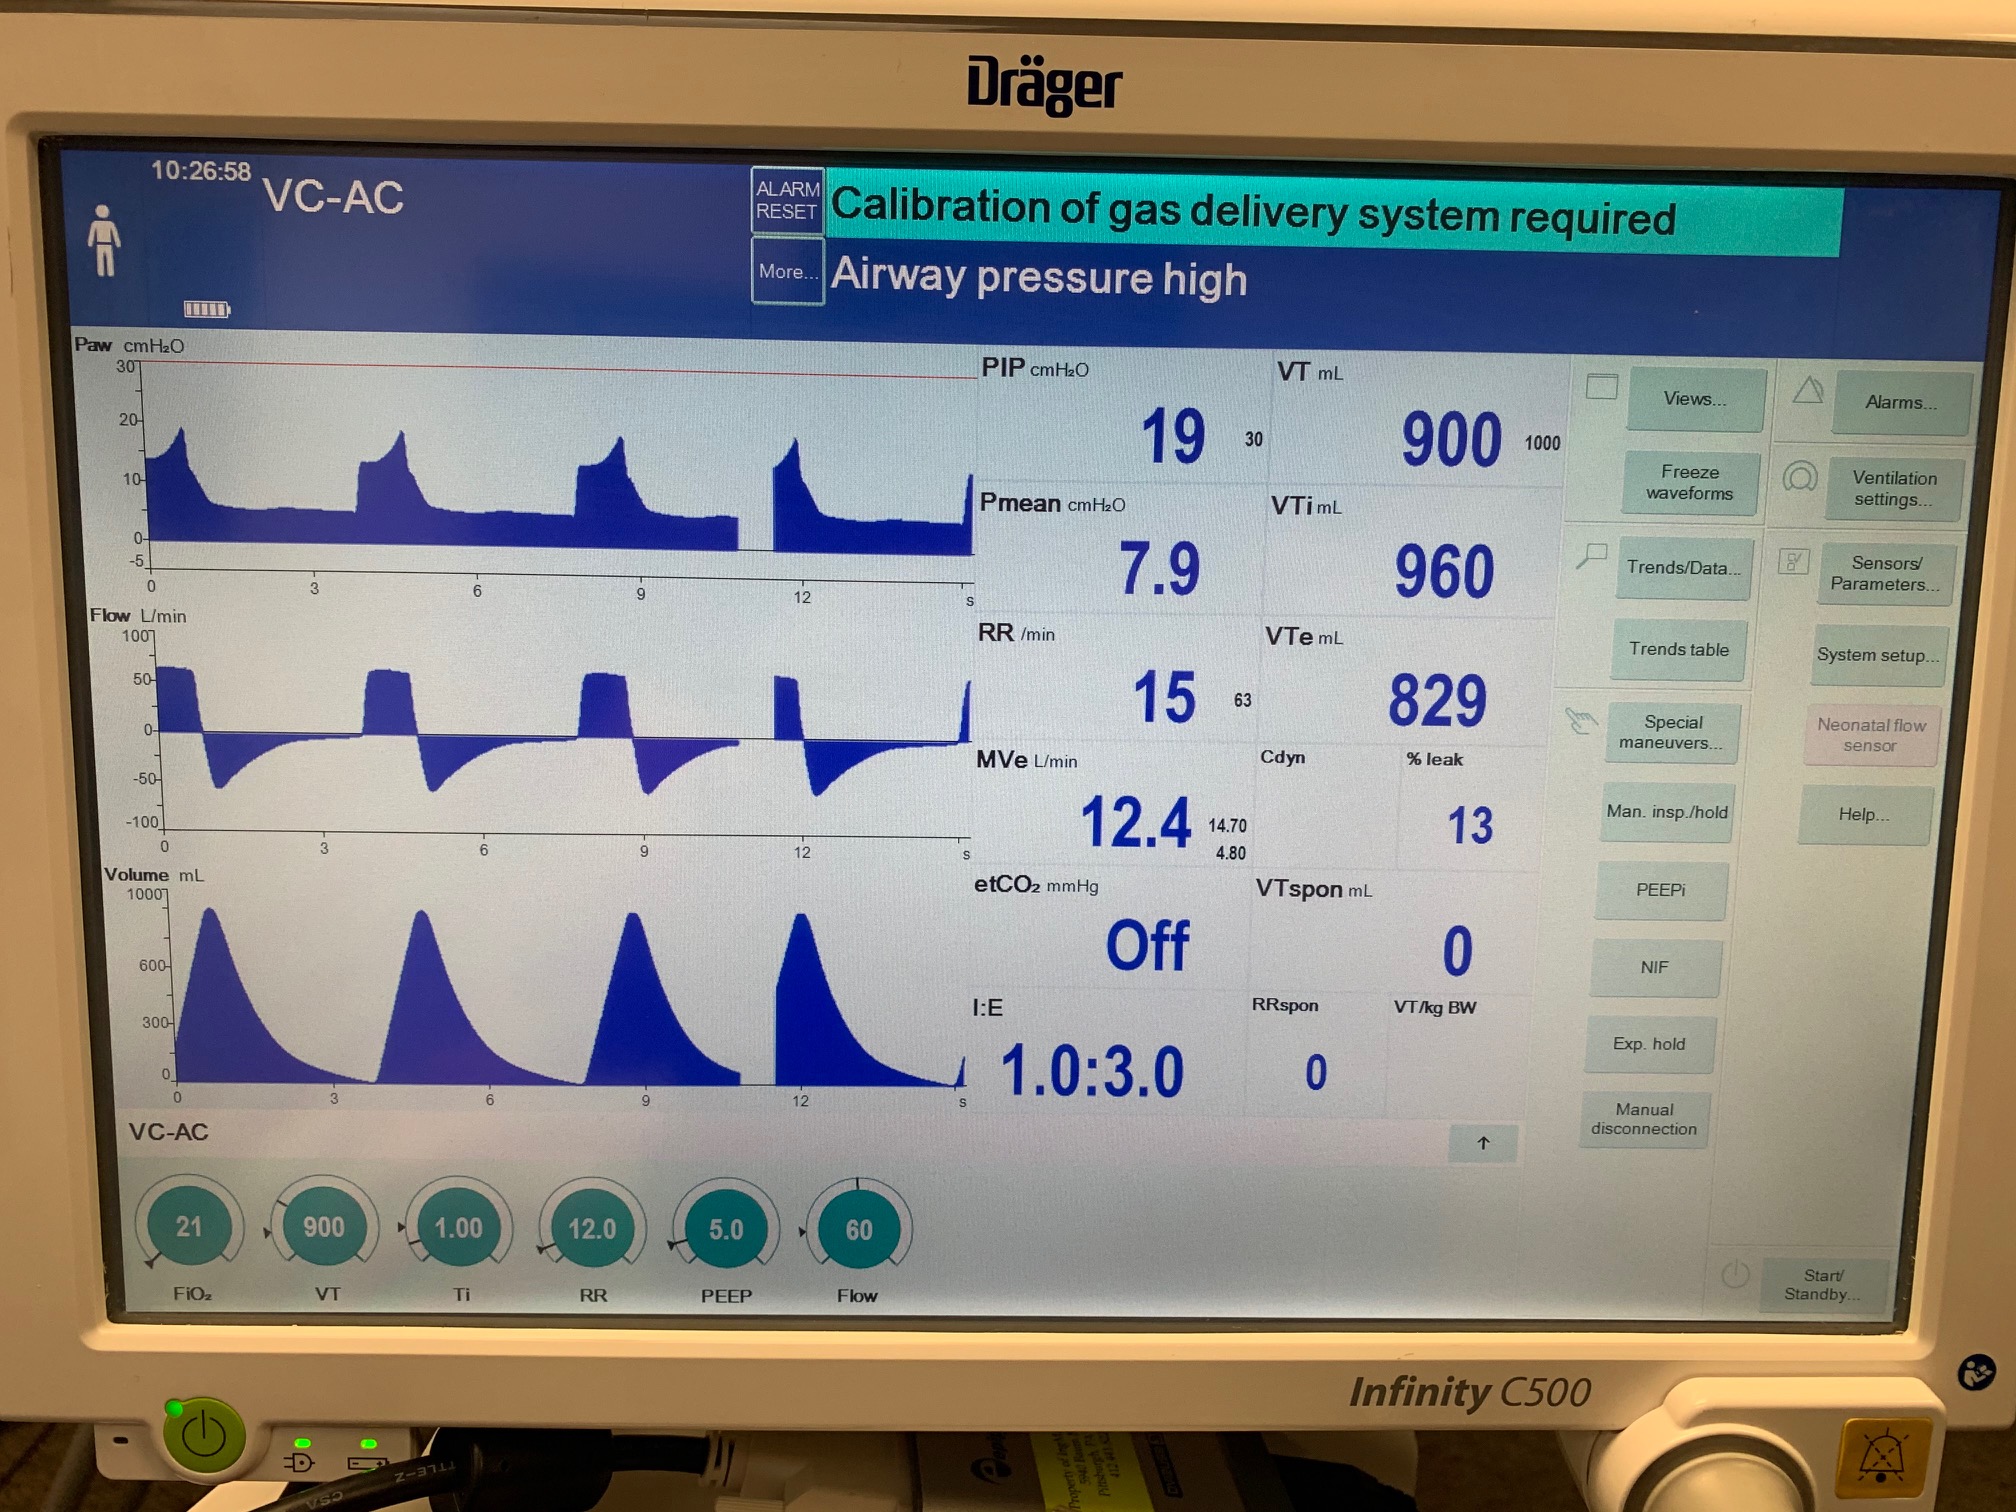
The waveforms created by the virtual ventilator match well with the displayed physical ventilator monitor values. The important temporal features and patterns used by Respiratory Therapists to manage patients [81] are present. However, the data shows that an extended inspiration time by the physical ventilator translates to higher TVs than come from our ideal, deterministic circuit model. Discrepancies with the TV outputs for the PC-AC and CPAP modes can be attributed to imperfections with real-world sampling, lags from sensor triggering, non-instantaneous driver transitions, and differences in assumptions about air humidification in the patient's lungs. This follows expectations from previous lung model bench tests showed major differences between mechanical ventilator devices in both general characteristics and technical reliability [208]. Most notable are large variability in TV delivery.
Healthy Patient
| Patient Setting | Value |
|---|---|
| Resistance (cmH2O-s/L) | 13 |
| Compliance (mL/cmH2O) | 50 |
| MusclePressure (cmH2O) | 13 |
| SpontaneousRespirationRate (bpm) | 15 |
| NeuralInspiratoryTime (s) | 0.9 |
VC-AC Mode
| Ventilator Setting | Value |
|---|---|
| TidalVolume (mL) | 900 |
| InspiratoryTime (s) | 1.0 |
| RespirationRate (bpm) | 12 |
| PositiveEndExpiredPressure (cmH2O) | 5 |
| Flow (L/min) | 60 |
 |
 |
 |
|
 |
 |
 |
 |
| Property Name | Expected Value | Engine Value | Percent Error |
|---|---|---|---|
| MechanicalVentilator-RespirationRate(1/min) (bpm) | 15 | Mean of 15.075 | 0.5% |
| MechanicalVentilator-MeanAirwayPressure(cmH2O) (cmH2O) | 7.9 | Mean of 8.263 | 4.5% |
| MechanicalVentilator-TidalVolume(mL) (mL) | 900 | Mean of 918.099 | 2.0% |
PC-AC Mode
| Ventilator Setting | Value |
|---|---|
| InspiratoryTime (s) | 1.0 |
| RespirationRate (bpm) | 12 |
| PositiveEndExpiredPressure (cmH2O) | 5 |
| PeakInspiratoryPressure (cmH2O) | 19 |
 |
 |
 |
|
 |
 |
 |
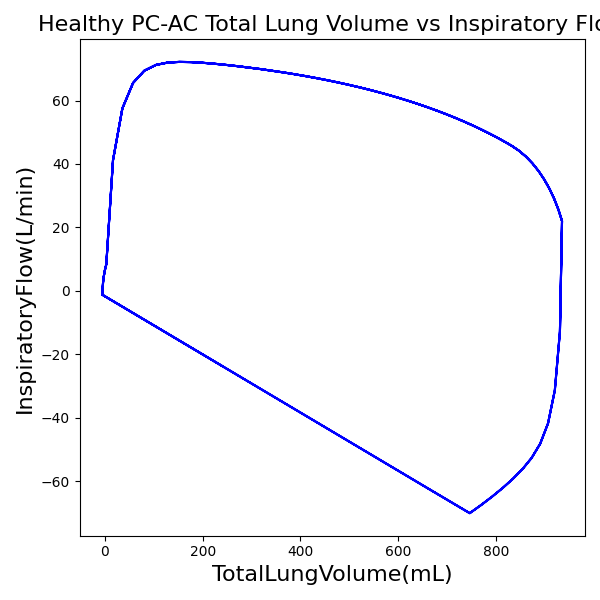 |
| Property Name | Expected Value | Engine Value | Percent Error |
|---|---|---|---|
| MechanicalVentilator-RespirationRate(1/min) (bpm) | 15 | Mean of 15.075 | 0.5% |
| MechanicalVentilator-MeanAirwayPressure(cmH2O) (cmH2O) | 8.6 | Mean of 8.447 | 1.8% |
| MechanicalVentilator-TidalVolume(mL) (mL) | 1047 | Mean of 935.217 | 11.3% |
CPAP Mode
| Ventilator Setting | Value |
|---|---|
| DeltaPressureSupport (cmH2O) | 10 |
| PositiveEndExpiredPressure (cmH2O) | 5 |
| Slope (s) | 0.2 |
 |
 |
 |
|
 |
 |
 |
 |
| Property Name | Expected Value | Engine Value | Percent Error |
|---|---|---|---|
| MechanicalVentilator-RespirationRate(1/min) (bpm) | 15 | Mean of 15.075 | 0.5% |
| MechanicalVentilator-MeanAirwayPressure(cmH2O) (cmH2O) | 6.9 | Mean of 7.437 | 7.5% |
| MechanicalVentilator-TidalVolume(mL) (mL) | 905 | Mean of 778.995 | 15.0% |
Restrictive Patient
| Patient Setting | Value |
|---|---|
| Resistance (cmH2O-s/L) | 20 |
| Compliance (mL/cmH2O) | 30 |
| MusclePressure (cmH2O) | 8 |
| SpontaneousRespirationRate (bpm) | 25 |
| NeuralInspiratoryTime (s) | 0.6 |
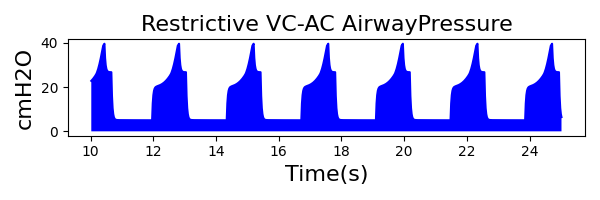
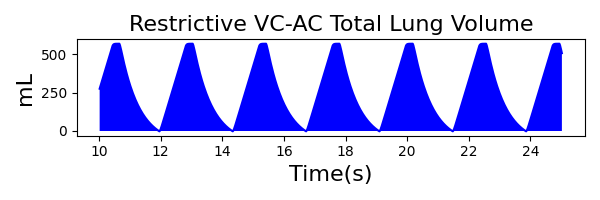
VC-AC Mode
| Ventilator Setting | Value |
|---|---|
| TidalVolume (mL) | 550 |
| InspiratoryTime (s) | 1.1 |
| RespirationRate (bpm) | 12 |
| PositiveEndExpiredPressure (cmH2O) | 5 |
| Flow (L/min) | 40 |
 |
 |
 |
|
 |
 |
 |
 |
| Property Name | Expected Value | Engine Value | Percent Error |
|---|---|---|---|
| MechanicalVentilator-RespirationRate(1/min) (bpm) | 25 | Mean of 25.210 | 0.8% |
| MechanicalVentilator-MeanAirwayPressure(cmH2O) (cmH2O) | 13 | Mean of 14.544 | 11.2% |
| MechanicalVentilator-TidalVolume(mL) (mL) | 550 | Mean of 568.772 | 3.4% |
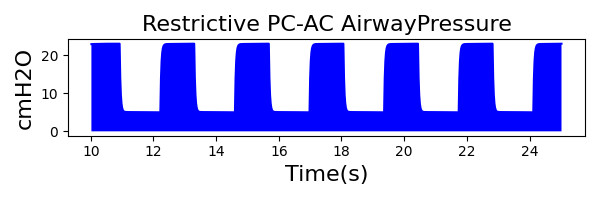
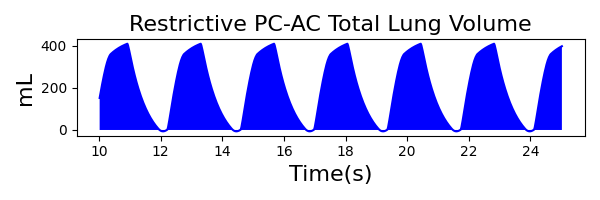
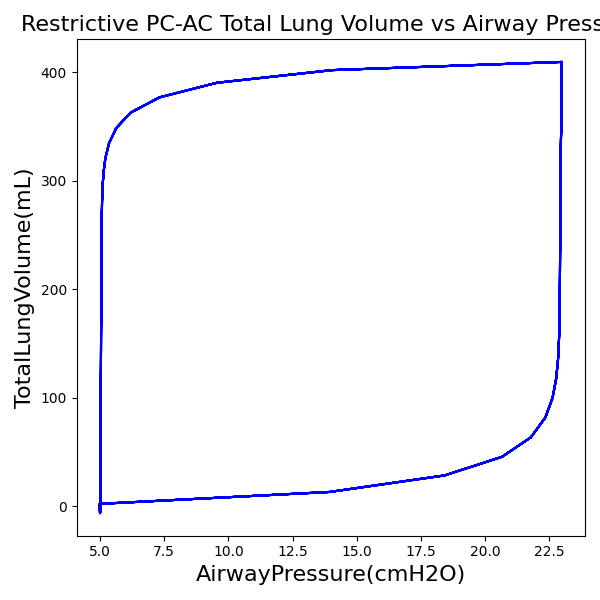
PC-AC Mode
| Ventilator Setting | Value |
|---|---|
| InspiratoryTime (s) | 1.1 |
| RespirationRate (bpm) | 12 |
| PositiveEndExpiredPressure (cmH2O) | 5 |
| PeakInspiratoryPressure (cmH2O) | 23 |
 |
 |
 |
|
 |
 |
 |
 |
| Property Name | Expected Value | Engine Value | Percent Error |
|---|---|---|---|
| MechanicalVentilator-RespirationRate(1/min) (bpm) | 25 | Mean of 25.210 | 0.8% |
| MechanicalVentilator-MeanAirwayPressure(cmH2O) (cmH2O) | 12 | Mean of 13.168 | 9.3% |
| MechanicalVentilator-TidalVolume(mL) (mL) | 528 | Mean of 409.437 | 25.3% |
CPAP Mode
| Ventilator Setting | Value |
|---|---|
| DeltaPressureSupport (cmH2O) | 10 |
| PositiveEndExpiredPressure (cmH2O) | 5 |
| Slope (s) | 0.2 |
 |
 |
 |
|
 |
|
 |
 |
| Property Name | Expected Value | Engine Value | Percent Error |
|---|---|---|---|
| MechanicalVentilator-RespirationRate(1/min) (bpm) | 25 | Mean of 25.210 | 0.8% |
| MechanicalVentilator-MeanAirwayPressure(cmH2O) (cmH2O) | 10 | Mean of 7.395 | 30.0% |
| MechanicalVentilator-TidalVolume(mL) (mL) | 387 | Mean of 274.827 | 33.9% |
Obstructive Patient
| Patient Setting | Value |
|---|---|
| Resistance (cmH2O-s/L) | 21 |
| Compliance (mL/cmH2O) | 53 |
| MusclePressure (cmH2O) | 14 |
| SpontaneousRespirationRate (bpm) | 18 |
| NeuralInspiratoryTime (s) | 1.0 |
VC-AC Mode
| Ventilator Setting | Value |
|---|---|
| TidalVolume (mL) | 500 |
| InspiratoryTime (s) | 1.1 |
| RespirationRate (/min) | 12 |
| PositiveEndExpiredPressure (cmH2O) | 5 |
| Flow (L/min) | 40 |
 |
 |
 |
|
 |
 |
 |
 |
| Property Name | Expected Value | Engine Value | Percent Error |
|---|---|---|---|
| MechanicalVentilator-RespirationRate(1/min) (bpm) | 18 | Mean of 18.072 | 0.4% |
| MechanicalVentilator-MeanAirwayPressure(cmH2O) (cmH2O) | 7.3 | Mean of 7.726 | 5.7% |
| MechanicalVentilator-TidalVolume(mL) (mL) | 493 | Mean of 517.498 | 4.8% |
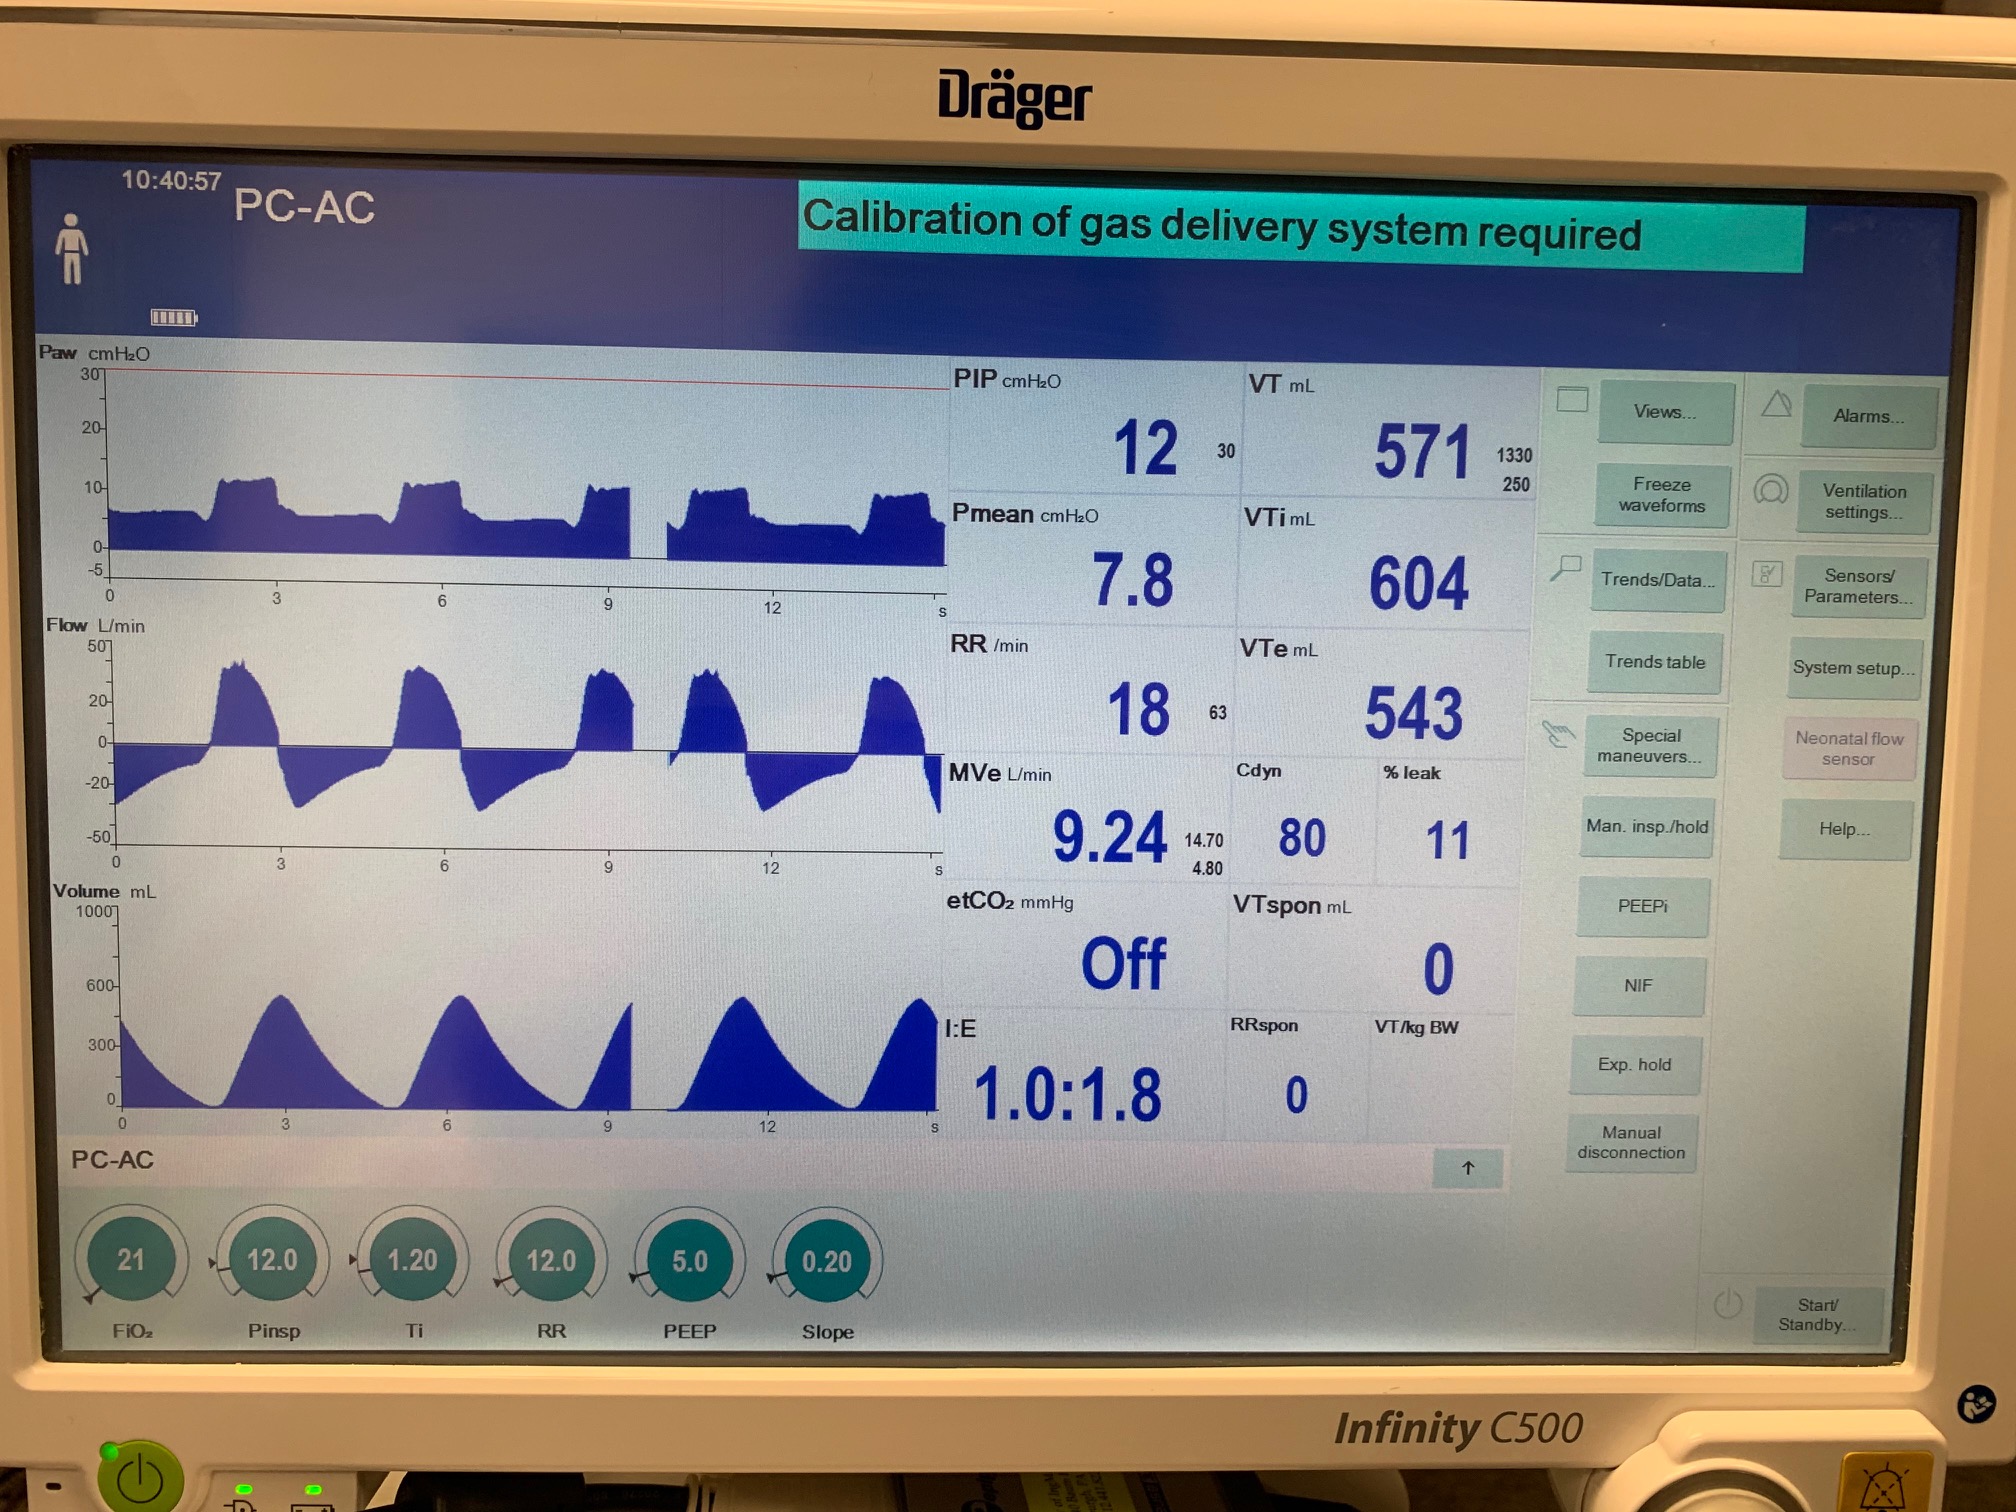
PC-AC Mode
| Ventilator Setting | Value |
|---|---|
| InspiratoryTime (s) | 1.2 |
| RespirationRate (bpm) | 12 |
| PositiveEndExpiredPressure (cmH2O) | 5 |
| PeakInspiratoryPressure (cmH2O) | 12 |
 |
 |
 |
|
 |
 |
 |
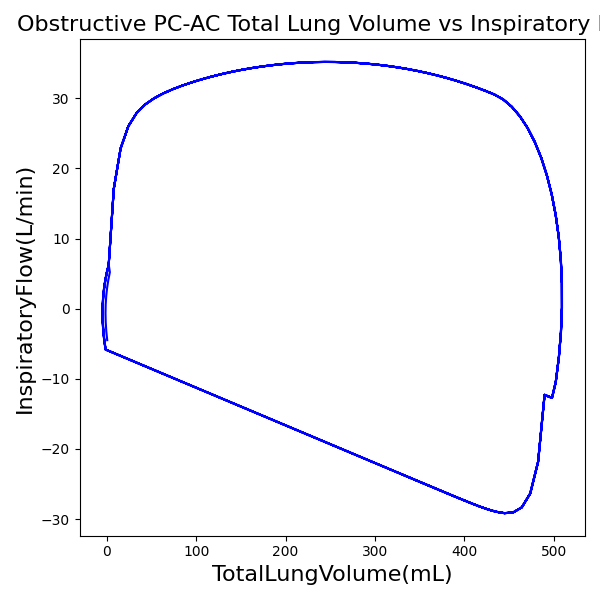 |
| Property Name | Expected Value | Engine Value | Percent Error |
|---|---|---|---|
| MechanicalVentilator-RespirationRate(1/min) (bpm) | 18 | Mean of 18.070 | 0.4% |
| MechanicalVentilator-MeanAirwayPressure(cmH2O) (cmH2O) | 7.8 | Mean of 7.488 | 4.1% |
| MechanicalVentilator-TidalVolume(mL) (mL) | 571 | Mean of 490.084 | 15.3% |
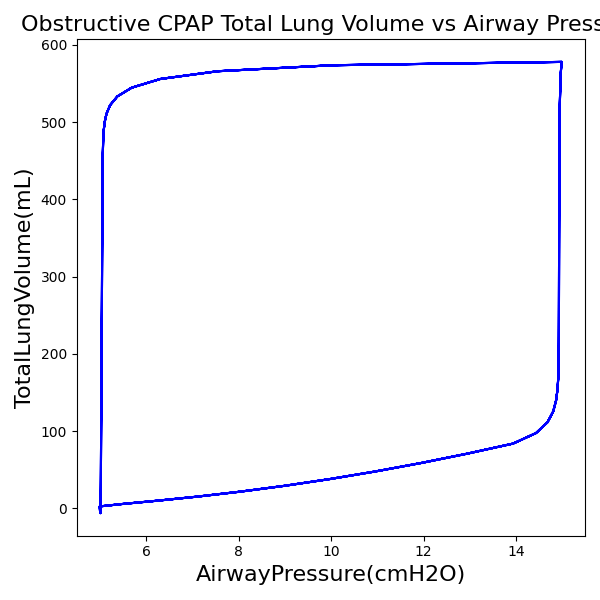
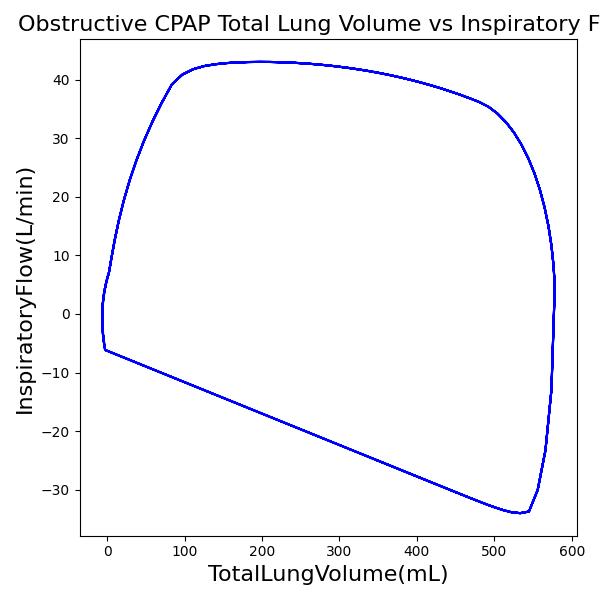
CPAP Mode
| Ventilator Setting | Value |
|---|---|
| DeltaPressureSupport (cmH2O) | 10 |
| PositiveEndExpiredPressure (cmH2O) | 5 |
| Slope (s) | 0.2 |
 |
 |
 |
|
 |
|
 |
 |
| Property Name | Expected Value | Engine Value | Percent Error |
|---|---|---|---|
| MechanicalVentilator-RespirationRate(1/min) (bpm) | 18 | Mean of 18.070 | 0.4% |
| MechanicalVentilator-MeanAirwayPressure(cmH2O) (cmH2O) | 8.5 | Mean of 7.862 | 7.8% |
| MechanicalVentilator-TidalVolume(mL) (mL) | 657 | Mean of 578.036 | 12.8% |
Validation - Healthy vs. ARDS vs. COPD
The Respiratory ARDS and COPD models with mild, moderate, and severe severities is extensively tested in the scenarios shown in Table 21. Each row is a separate invasive mechanical ventilation scenario that is run for several minutes to reach a new homeostatic point based on the patient's disease state and ventilator settings. The patient is administered a neuromuscular blockade to prevent spontaneous breathing for all but the VC-AC scenario. Typical/ideal ventilator setting are used based on literature [17] [98] [242] and subject matter [292] input. Results successfully match expected empirical data and trends.
Table 21. Cumulative validation results for ventilator specific scenarios.
| Key |
|---|
| Good agreement: correct trends or <10% deviation from expected |
| Some deviation: correct trend and/or <30% deviation from expected |
| Poor agreement: incorrect trends or >30% deviation from expected |
| Patient State | Ventilator Settings | Respiration Rate (bpm) | Inspiratory-Expiratory Ratio | Pulmonary Resistance (cmH2O-s/L) | Pulmonary Compliance (L/cmH2O) | pH | Arterial Carbon Dioxide Pressure (mmHg) | Arterial Oxygen Pressure (mmHg) | PaO2/FiO2 (mmHg) | Oxygen Saturation (%) | Pulmonary Shunt Fraction (%) | Alveolar Dead Space (L) |
|---|---|---|---|---|---|---|---|---|---|---|---|---|
| Healthy | Mode: PC-CMV Inspiratory Pressure Target: set empirically to achieve VT Target VT Target (mL/kg): 7 VT Target (mL): 527 PEEP (cm H2O): 5 FiO2 (%): 30 Mandatory Rate (bpm): 15 I:E: 0.60 Minute Ventilation (L/min): 7.9 | 15 (ventilator setting) | 0.6 (ventilator setting) | 12-17 [17], [18] | 20-54 [17], [18] | 7.27-7.40 [17] | 35-42 [17] | 85-114 [17] | 264-366 [17], [115] | 96.4-98.5 [17], [177] | 2-5 [207], [279], [269] | ~0 [207] |
| Healthy | Mode: VC-CMV Inspiratory Pressure Target: set empirically to achieve VT Target VT Target (mL/kg): 7 VT Target (mL): 527 PEEP (cm H2O): 5 FiO2 (%): 30 Mandatory Rate (bpm): 15 I:E: 0.60 Minute Ventilation (L/min): 7.9 | 15 (ventilator setting) | 0.6 (ventilator setting) | 12-17 [17], [18] | 20-54 [17], [18] | 7.27-7.40 [17] | 35-42 [17] | 85-114 [17] | 264-366 [17], [115] | 96.4-98.5 [17], [177] | 2-5 [207], [279], [269] | ~0 [207] |
| Healthy | Mode: VC-AC Inspiratory Pressure Target: set empirically to achieve VT Target VT Target (mL/kg): 7 VT Target (mL): 527 PEEP (cm H2O): 5 FiO2 (%): 30 Mandatory Rate (bpm): 15 I:E: 0.60 Minute Ventilation (L/min): 7.9 | 15-21 [17] | 0.4-0.8 [17] | 12-17 [17], [18] | 20-54 [17], [18] | 7.27-7.40 [17] | 35-42 [17] | 85-114 [17] | 264-366 [17], [115] | 96.4-98.5 [17], [177] | 2-5 [207], [279], [269] | ~0 [207] |
| Mild ARDS (severity = 0.3) | Mode: PC-CMV Inspiratory Pressure Target: set empirically to achieve VT Target VT Target (mL/kg): 6 VT Target (mL): 452 PEEP (cm H2O): 11 FiO2 (%): 40 Mandatory Rate (bpm): 17 I:E: 0.90 Minute Ventilation (L/min): 7.6 | 17 (ventilator setting) | 0.9 (ventilator setting) | No change, 10-16 [17], [18] | Decrease, 20-54 [17], [18] | 7.15-7.34 [17] | 45-57 [17] | 103-133 [17] | Decrease, 200-300 [115] | 98.0-99.0 [17], [177] | Increase, >10% [279], [269] | Increase [251] |
| Moderate ARDS (severity = 0.6) | Mode: PC-CMV Inspiratory Pressure Target: set empirically to achieve VT Target VT Target (mL/kg): 6 VT Target (mL): 452 PEEP (cm H2O): 11 FiO2 (%): 70 Mandatory Rate (bpm): 20 I:E: 0.90 Minute Ventilation (L/min): 9.0 | 20 (ventilator setting) | 0.9 (ventilator setting) | No change, 10-16 [17], [18] | Decrease, 20-54 [17], [18] | 7.15-7.34 [17] | 45-57 [17] | 81-117 [17] | Decrease, 100-200 [115] | 95.9-98.6 [17], [177] | Increase, >20% [279], [269] | Increase [251] |
| Severe ARDS (severity = 0.9) | Mode: PC-CMV Inspiratory Pressure Target: set empirically to achieve VT Target VT Target (mL/kg): 6 VT Target (mL): 452 PEEP (cm H2O): 11 FiO2 (%): 100 Mandatory Rate (bpm): 25 I:E: 0.90 Minute Ventilation (L/min): 11.5 | 25 (ventilator setting) | 0.9 (ventilator setting) | No change, 10-16 [17], [18] | Decrease, 20-54 [17], [18] | 7.15-7.34 [17] | 45-57 [17] | 56-83 [17] | Decrease, <100 [115] | 88.8-96.1 [17], [177] | Increase, >40% [279], [269] | Increase [251] |
| Mild COPD (severity = 0.3) | Mode: PC-CMV Inspiratory Pressure Target: set empirically to achieve VT Target VT Target (mL/kg): 9.0 VT Target (mL): 678 PEEP (cm H2O): 8 FiO2 (%): 31 Mandatory Rate (bpm): 12 I:E: 0.43 Minute Ventilation (L/min): 8.0 | 12 (ventilator setting) | 0.43 (ventilator setting) | Increase, 17-26 [17], [18] | Increase, 46-61 [17], [18] | 7.2-7.31 [17] | 44-67 [17] | 77-94 [17] | Decrease, 206-295 [115] | 95.2-97.3 [17], [177] | Increase [37] | Increase [207] |
| Moderate COPD (severity = 0.6) | Mode: PC-CMV Inspiratory Pressure Target: set empirically to achieve VT Target VT Target (mL/kg): 8.5 VT Target (mL): 640 PEEP (cm H2O): 8 FiO2 (%): 31 Mandatory Rate (bpm): 14 I:E: 0.43 Minute Ventilation (L/min): 9.0 | 14 (ventilator setting) | 0.43 (ventilator setting) | Increase, 17-26 [17], [18] | Increase, 46-61 [17], [18] | 7.2-7.31 [17] | 44-67 [17] | 77-94 [17] | Decrease, 206-295 [115] | 95.2-97.3 [17], [177] | Increase [37] | Increase [207] |
| Severe COPD (severity = 0.9) | Mode: PC-CMV Inspiratory Pressure Target: set empirically to achieve VT Target VT Target (mL/kg): 9.0 VT Target (mL): 678 PEEP (cm H2O): 8 FiO2 (%): 40 Mandatory Rate (bpm): 15 I:E: 0.43 Minute Ventilation (L/min): 10.2 | 15 (ventilator setting) | 0.43 (ventilator setting) | Increase, 17-26 [17], [18] | Increase, 46-61 [17], [18] | 7.2-7.31 [17] | 44-67 [17] | 77-94 [17] | Decrease, 206-295 [115] | 95.2-97.3 [17], [177] | Increase [37] | Increase [207] |
Conclusion
While the model is a generic representation of mechanical ventilation, inhaled gases, and inhaled agent administration, this model represents the behavior of a complex piece of equipment that is associated with a difficult medical specialty. The engine provides a whole-body approach to modeling that allows for simulation of this complex field. This system is a strong addition to the engine with the potential for future development. This mechanical ventilator model can be used in a standalone Pulse application or integrated with simulators, sensor interfaces, and models of all fidelities. The data model has been carefully defined and implemented to allow for future expansion, including the implementation of patient-specific physiological and pathophysiological models
Future Work
Coming Soon
Logic and results for handling more ventilation modes.
Recommended Improvements
The inherent modularity of this model could be leveraged to add parameters and elements for specific equipment models and manufacturers.
Appendices
Data Model Implementation
Acronyms
API - Application Programming Interface
ARDS - Acute Respiratory Distress Syndrome
CDM - Common Data Model
CPAP - Continuous Positive Airway Pressure
FiO2 - Fraction of Inspired Oxygen
FRC - Functional Residual Capacity
I:E Ratio - Inspiratory-Expiratory Ratio
PaO2 - Arterial Oxygen Partial Pressure
PC-AC - Pressure Control - Assist Control
PC-CMV - Pressure Control - Continuous Mandatory Ventilation
PEEP - Positive End Expired Pressure
PIP - Peak Inspiratory Pressure
SpO2 - Oxygen Saturation
VC-AC - Volume Control - Assist Control
VC-CMV - Volume Control - Continuous Mandatory Ventilation