Overview
Abstract
This Tissue system manages the extravascular space. It handles substance transport between the organs and the blood vessels, and it computes substance storage, transformation (e.g. chemical conversion), clearance, and excretion.
Introduction
The Tissue system is a low-resolution, mid-fidelity model of the tissues of the body. The system is mechanically tied to the Cardiovascular and Respiratory systems, and it interacts with the Energy and Drugs systems. The tissue system handles the non-advective transport of substances between the intravascular and extravascular spaces, as well as the conversion of substance (including chemical conversion of species and clearance/excretion). The metabolic production and consumption of substances takes place in the tissue system, and the tissues generate substances that are produced in the organs by any process or mode.
System Design
Background and Scope
Groups of cells in the body which share a common embryonic origin can be described collectively as a tissue. In the classical organizational hierarchy of organisms, tissues are at the level directly below organs, meaning that groups of tissues interacting to perform a function are an organ. There are four types of tissue in the human body: epithelial, connective, muscle, and nervous tissue. In the engine, the term tissue refers to the extravascular space of an organ. In other words, 'tissue', is a collective term which generally refers to the parenchyma.
Data Flow
Like the other systems, the Tissue system uses the execution structure described in System Methodology.
Preprocess
Produce Albumin
The liver produces albumin as part of normal function. The engine does not have a dedicated hepatic model; therefore, a flat rate of albumin production is estimated in Tissue. The rate has been specified as 0.15 mg/s, as found in [174]. At each time step, the mass is added to the liver extracellular compartment. Hepatic albumin production is non-functional in the current implementation as the substance does not transport out of the tissue compartment. Improvements to the albumin production and transport model are planned.
Process
Calculate Metabolic Consumption and Production
Substance production and consumption is computed based on the metabolic rate and the respiratory quotient.
Calculate Pulmonary Capillary Substance Transport
Gases are transferred from the lungs (alveoli) to the pulmonary capillaries and vice versa during this calculation. This allows for the transport of oxygen into the cardiovascular system from the ambient air, providing the required substances for metabolism. By the same process, carbon dioxide waste is removed from the Cardiovascular System and moves through the Respiratory System into the ambient air.
Calculate Diffusion
Substances move from the vascular space into and out of the extravascular or tissue space for metabolism, waste removal, and/ or clearance. This functionality moves gases across the membrane between the vascular and extravascular spaces using one or more of several diffusion models, discussed below.
- Perfusion Limited Diffusion
- Instant Diffusion
- Simple Diffusion
- Facilitated Diffusion
- Active Transport
Calculate Vital Signs
In this method the tissue volumes are summed in order to compute total body water. Body system level data is also set in this method. In the future, this method will compute and set tissue substance concentrations and trigger concentration-based events such as fasciculation.
Post Process
At this time the there are no postprecess steps in the tissue system.
Assessments
Assessments are data collected and packaged to resemble a report or analysis that might be ordered by a physician. No assessments are associated with the Tissue system.
Features, Capabilities, and Dependencies
The Tissue system is a low-resolution, mid-fidelity model of the tissues of the body. One of the primary functions of the Tissue system is to control the transport of substances between the tissues and the blood. There are several transport models which help the Tissue system perform that function. Figure 2 provides an overview of the extravascular space and the various modes of substance transport between the blood and the tissues. The Tissue system also handles the conversion of substance (i.e. metabolic consumption and production).
Bulk Flow and Advection
The movement of fluid between the intravascular and extravascular space is modeled using the Circuit Methodology. Figure 3 shows a representative circuit diagram. In most cases, each tissue circuit node is connected to one and only one cardiovascular circuit node. However, the gut tissue compartment is a lumped representation of the abdominal viscera organ tissues, and thus the large intestine, small intestine, and splanchnic vascular circuit nodes all connect to the gut tissue circuit node.
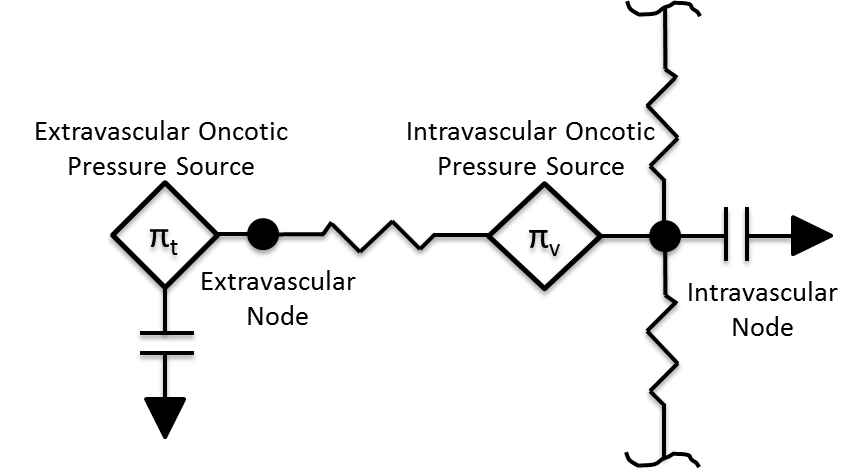
The volume in the tissue compartment is partitioned into the extracellular and intracellular space, as shown in Figure 2. The extracellular partition is connected to the circuit model, whereas the intercellular partition is seperate to allow for a non-linear control of the fluid flow dynamics. Although fluid moves according to the circuit model, there is no advective transport into the parenchyma. All substance transport into the tissue fluid space is simulated using one or more of the transport modes described below.
Patient Variability
The Tissue system is heavily dependent on the patient configuration. Fluid volume distributions and parenchyma masses both depend heavily on the patient sex, height, weight, and body fat fraction. Transport properties are also affected by patient variability. For example, permeability coefficients are computed from membrane permeability and membrane surface area, where the surface area is a function of the tissue mass, which in turn is a function of the patient weight. A detailed discussion of patient configuration and variability is available in the Patient Methodology report.
Perfusion-Limited Diffusion
Perfusion-limited diffusion is a technique for describing drug kinetics in physiology-based pharmacokintic models. Partition coefficents are used to compute the amount of a drug crossing a membrane at a given perfusion rate. The partition coefficients are calculated based on the physical chemical properties of the drug, the tissue properties of the organ, and the blood properties. They represent a specific substance’s affinity for moving across the blood-tissue partition. The engine uses this methodology to simulate drug diffusion, and details of the partition coefficient calculation can be found in the Drugs Methodology. All current drugs in the engine use perfusion-limited diffusion as found in [182] [169]. In the future, permeability-limited diffusion could be used. Equation 1 shows the calculation used to move mass from the vascular to the tissue and vice versa for perfusion-limited diffusion [182] .
![\[\Delta M = Q_{T} * C_{V} - \frac{Q_{T} * C_{T}}{K_{P}} \]](form_190.png)
Where ΔM is the change in mass due to diffusion, *QT* is the blood flow to the organ, *CV* is the concentration of the drug in the organ vasculature, *CT* is the concentration of the drug in the organ tissue, and *KP* is the partition coefficient for the drug and organ. This calculation is performed for each drug or substance and each tissue organ/compartment.
Gradient Dependent Transport Processes
Gas Exchange - Alveoli Transfer
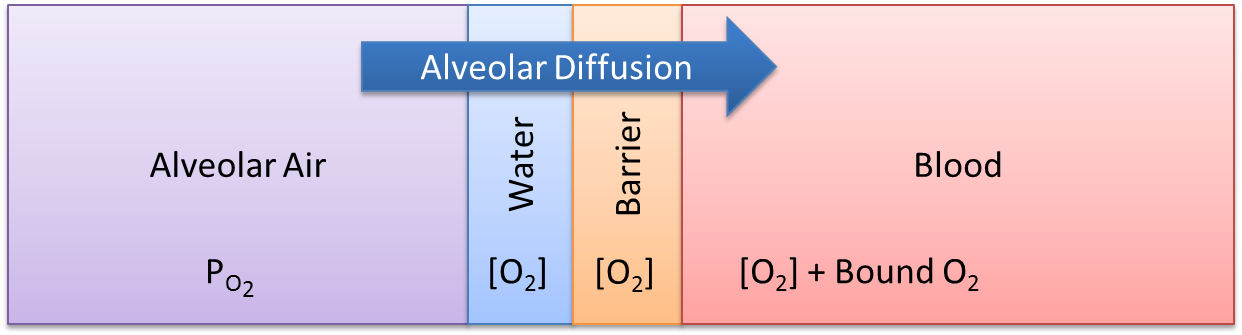
At the alveoli-pulmonary capillary interface, oxygen diffuses from the alveoli into the pulmonary capillaries, while carbon dioxide diffuses from the pulmonary capillaries into the alveoli. In reality, gas exchange at the alveoli is a multi-step process in space, where gases dissolve into liquid according to Henry's law and diffuse through liquid and across membranes according to Fick's law. In the model, alveolar gas exchange is driven by the partial pressure differential between the pulmonary capillaries and the alveoli in a one-step process, as shown in Figure 4. The partial pressures of each gas in the capillaries are calculated using Equation 2, while the partial pressures of each gas in the alveoli are calculated using Equation 3.
![\[P_{P} = \frac{C}{d * C_{S}} \]](form_191.png)
![\[P_{P} = P * V_{f} \]](form_192.png)
Where, *Pp* is the partial pressure, C is the concentration, d is the density, *Cs* is the solubility coefficient, P is the total pressure, and *Vf* is the volume fraction.
The diffusion rate is calculated using Equation 4 [148] .
![\[\dot{D} = \frac{D_{co} * C_{D} * \Delta P_{P} * SA_{a}}{D_{d}} \]](form_193.png)
Where *Dco* is the diffusing capacity of oxygen, *CD* is the relative diffusion coefficient, \delta *Pp* is the partial pressure differential between the alveoli and the capillaries, *SAa* is the surface area of the alveoli, and *Dd* is the diffusion distance. The surface area of the alveoli for an individual patient is related to the standard alveoli surface area and the patient’s total lung capacity. This calculation is shown in Equation 5.
![\[SA_{a} = \frac{TLC_{p}}{TLC_{s}} * SA_{as} \]](form_194.png)
Where *TLCp* is the total lung capacity of the patient, as specified in the patient file (PatientData). *TLCs* is the standard healthy total lung capacity of 5.8 L [148] . The *SAas* is standard alveoli surface area of 70 square meters [148]. For more information about patient variability, please see the Patient Methodology report.
The mass diffused at each time step is calculated using Equation 6. This mass is either added or removed from the pulmonary capillaries and the corresponding volume is either added or removed from the alveoli.
![\[D_{m} = \dot{D} * \Delta t * d \]](form_195.png)
Instant Diffusion
Some substances are able to diffuse across biological membranes at a rate that ensures concentration equilibrium within one engine time step. The instant diffusion model is included in the Tissue system in order to simulate transport processes that fully evolve in a time period much smaller than the engine time step. All of the gases are transported by instant diffusion.
Simple Diffusion
Simple diffusion is an implementation of Fick's law in one dimension with a known constant distance. In this case, Fick's law can be described by Equation 7.
![\[J_{X} = P_{x} * \left([X]_{v} - [X]_{t} \right) \]](form_196.png)
Where *Jx* is the mass flux (mass per area-time) of substance X, *[X]v,t* is the concentration of substance X in compartment v (or t), and *Px* is a proportionality constant defining the permeability. The flux is multiplied by an area to obtain a rate of mass transfer. It is incredibly difficult to experimentally determine the capillary surface area for a given tissue, and it may be impossible to experimentally determine the total cellular membrane surface area. Additionally, lumped tissue models can be difficult to delineate. In the engine, the capillary and cellular membrane surface areas are assumed to be proportional to the mass of a given organ or tissue group, such that the mass transfered in one time step (*Dm*) may be computed by Equation 8, where k is the empirically-determined constant relating the tissue mass (*mt*) to the surface area.
![\[ D_{m} = k * m_{t} * J_{X} * \Delta t \]](form_197.png)
Facilitated Diffusion
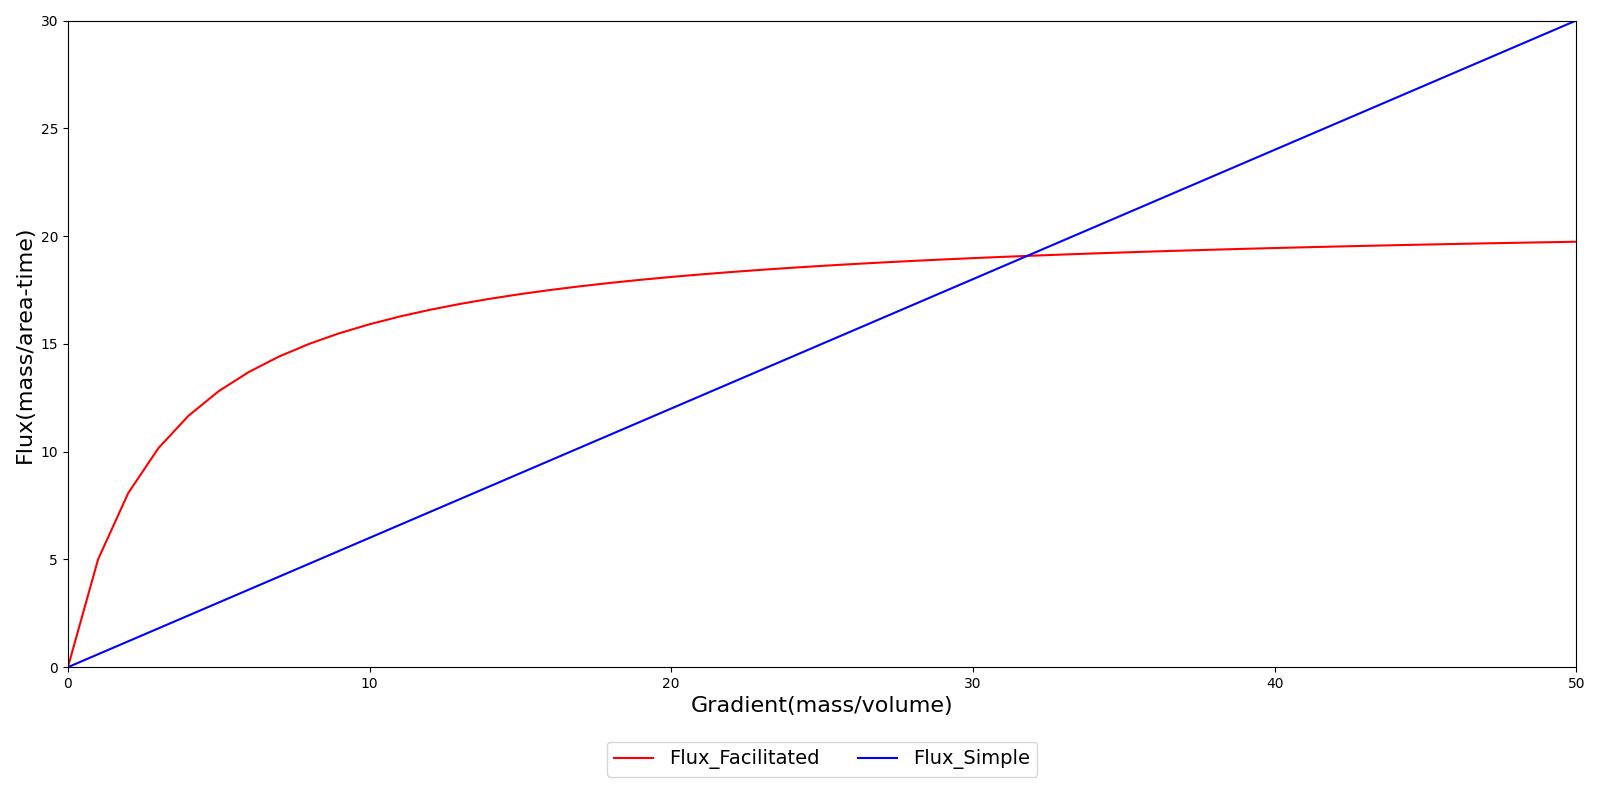
Facilitated diffusion uses Michaelis-Menten kinetics to model the facilitated transport across a membrane. Note that this type of diffusion does not require energy and it is still a gradient-based transport mode. In contrast to simple diffusion, where substance flux can continue to increase with the concentration gradient, the flux is asymptotic in facilitated diffusion. The flux limit reflex a saturation of the membrane transporter mechanisms. However, at smaller concentration gradients, substance flux is higher in facilitated diffusion than with simple Fick's law diffusion. Figure 5 demonstrates the difference in flux between facilitated and simple diffusion. The mass flux given by Michaelis-Menten kinetics is computed using Equation , where *Jmax* is the maximum flux and *Km is the Michaelis constant.
![\[ J_{X} = \frac{\left([X]_{v} - [X]_{t} \right) * J_{max}}{K_{m} * \left([X]_{v} - [X]_{t} \right)} \]](form_198.png)
Gradient Independent Transport Processes
Active Transport
Active transport is a coarse model of the energy-requiring transport processes (e.g. the sodium-potassium pump). The active transport functionality is currently inactive while work continues on comprehensive substance handling. When complete, active transport will use energy (through feedback to consumption rates of energy-containing substances) to move substances across barriers.
Metabolic Production and Consumption
Metabolism is simulated by production and consumption of substances. The basis for the metabolic production and consumption calculations is the non-protein respiratory quotient (RQ). This value is used to determine the fraction of the metabolic energy that is produced through carbohydrate (glucose) consumption. The curve is determined from data obtained from Gropper and Smith [142] and is displayed in Figure 6.
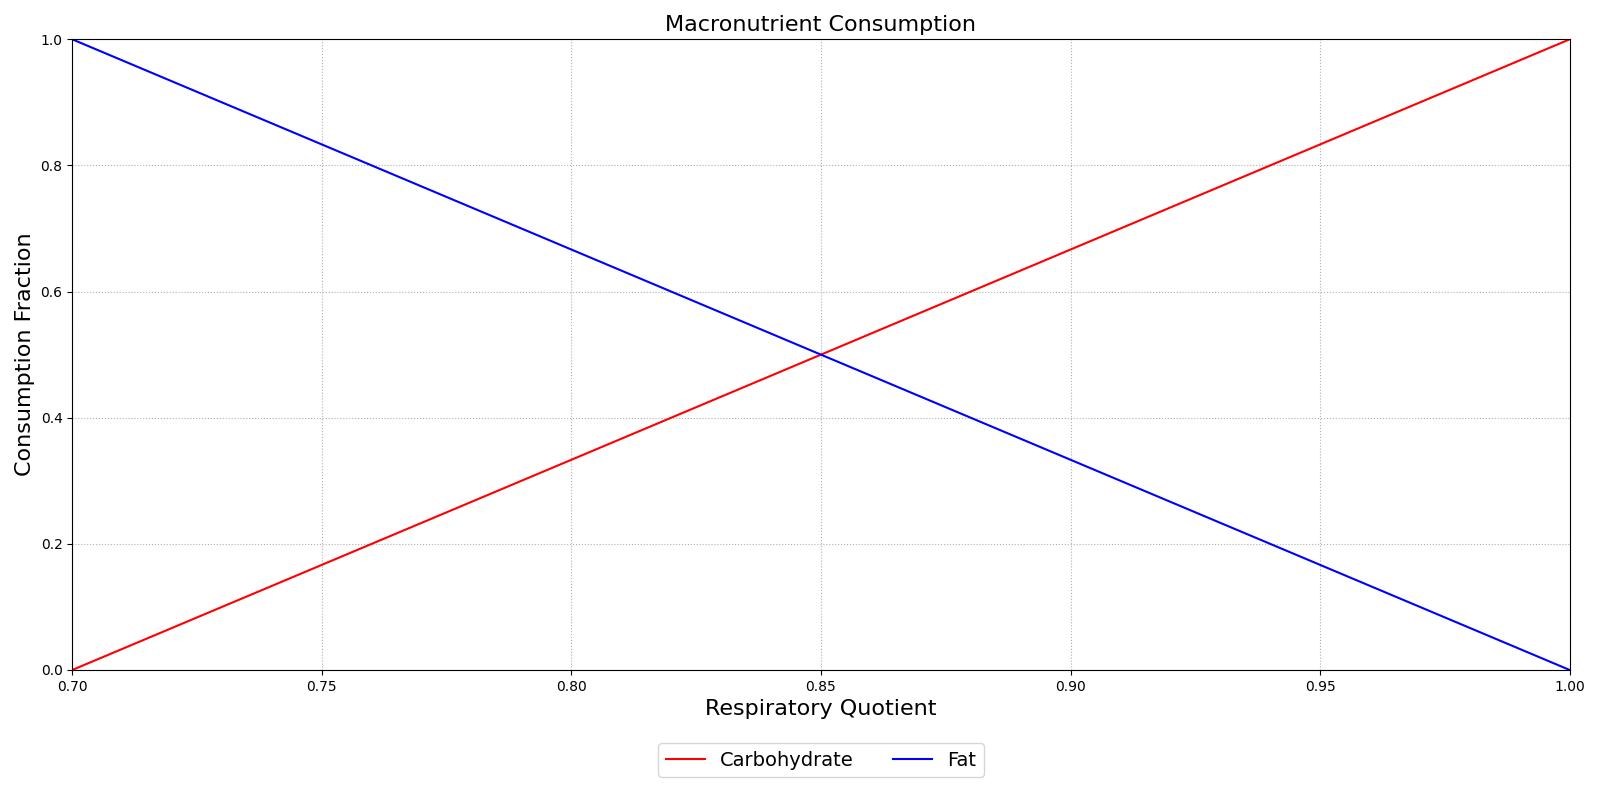
The fraction of carbohydrates consumed determines the removal of glucose, with the remaining portion of the fraction determining the removal of tristearin. Glucose is removed in one of two pathways: aerobic metabolism or anaerobic metabolism. The ratio of aerobic to anaerobic metabolism is determined from an anaerobic weighting factor. This factor is defined as the current oxygen partial pressure in the tissue over a resting value of 40 mmHg [112]. The anaerobic weight is shown in Equation 0.
![\[w(t) = \frac{P_{O_{2}}(t)}{P_{O_{2,rest}}} \]](form_199.png)
After the fractions of the metabolism have been defined, the exact consumption rates can be determined from molar ratios of nutrient input to ATP (energy) output. Table 1 shows the molar input to output ratios.
| Molar Ratio | Value |
|---|---|
| Glucose To ATP | 1/38 |
| Glucose To Lactic Acid | 1/2 |
| Oxygen To ATP from Glucose Consumption | 6/38 |
| Carbon Dioxide To ATP from Glucose Consumption | 6/38 |
| Oxygen To ATP from Lipid Consumption | 163/768 |
| Carbon Dioxide To ATP from Lipid Consumption | 114/768 |
| Lactate To ATP | 1/36 |
| Acetoacetate To ATP | 1/24 |
The substance to ATP ratios are used to determine the consumption and production rates in the tissues, given in units of moles per time in Table 2.
| Substance | Consumption | Production | Tissues |
|---|---|---|---|
| Glucose |
| N/A | All |
| Lipid |
| N/A | All |
| Acetoacetate |
|
| Production: Liver Consumption: Myocardium, Brain, Muscle |
| Lactate |
|
| Production: All Consumption: Myocardium, Brain |
| Oxygen |
| N/A | All |
| Carbon Dioxide | N/A |
| All |
![\[ F_{g}*\left(w_{O_{2}}*\frac{ \dot{M}_{ATP}}{38} + \left(1-w_{O_{2}} \right) * \frac{ \dot{M}_{ATP}}{2} \right) \]](form_200.png)
![\[ \left(1-F_{g} \right) \left( \frac{2}{768} \right) \dot{M}_{ATP} \]](form_201.png)
![\[ \left( \frac{1}{24} \right) \dot{M}_{ATP} \]](form_202.png)
![\[ \dot{M}_{ketone} = \dot{M}_{ketone,base} + \left(1-F_{g} \right) \dot{M}_{ketone,max} \]](form_203.png)
![\[ \left( \frac{1}{36} \right) \dot{M}_{ATP} \]](form_204.png)
![\[ F_{g} * \left(1-w_{O_{2}} \right) \dot{M}_{ATP} \]](form_205.png)
![\[ F_{g} w_{O_{2}} \frac{6}{38} \dot{M}_{ATP} + \left(1-F_{g} \right) \frac{163}{768} \dot{M}_{ATP} \]](form_206.png)
![\[ F_{g} w_{O_{2}} \frac{6}{38} \dot{M}_{ATP} + \left(1-F_{g} \right) \frac{114}{768} \dot{M}_{ATP} \]](form_207.png)
Assumptions and Limitations
Proteins are large molecules which take up space. About 7% of plasma volume is due to proteins. Proteins also have a net negative charge. in reality, diffusion depends on the elctrochemical gradient, not just the chemical gradient. With the exception of the perfusion-limited diffusion model, the diffusion models do not account for the entire elecrochemical gradient or the volume of the protein in the plasma (i.e. no "plasma water").
The diffusional exchange of water between the capillaries and extravascular space amounts to as much as 80,000 liters per day. Convective capillary exchange is much less, on the order of 16 liters per day. The diffusional exchange of water is not modeled in the engine.
Conditions
There are no conditions associated with the Tissue system.
Actions
At this time, there are no insults or interventions associated with the Tissue system. Other system actions can affect the diffusion properties or other transports by modifying the diffusion surface area. An example of this is found in the Respiratory Methodology for lobar pneumonia. As the alveoli fill with fluid, they are unable to participate in gas exchange. This reduces the alveoli surface area, which leads to a reduction of available oxygen in the CardiovascularSystem and the EnergySystem.
Events
- Dehydration: Set when fluid loss exceeds 3% of body mass [380]
- Fasciculation: Event currently inactive while substance handling is improved
Results and Conclusions
Verification
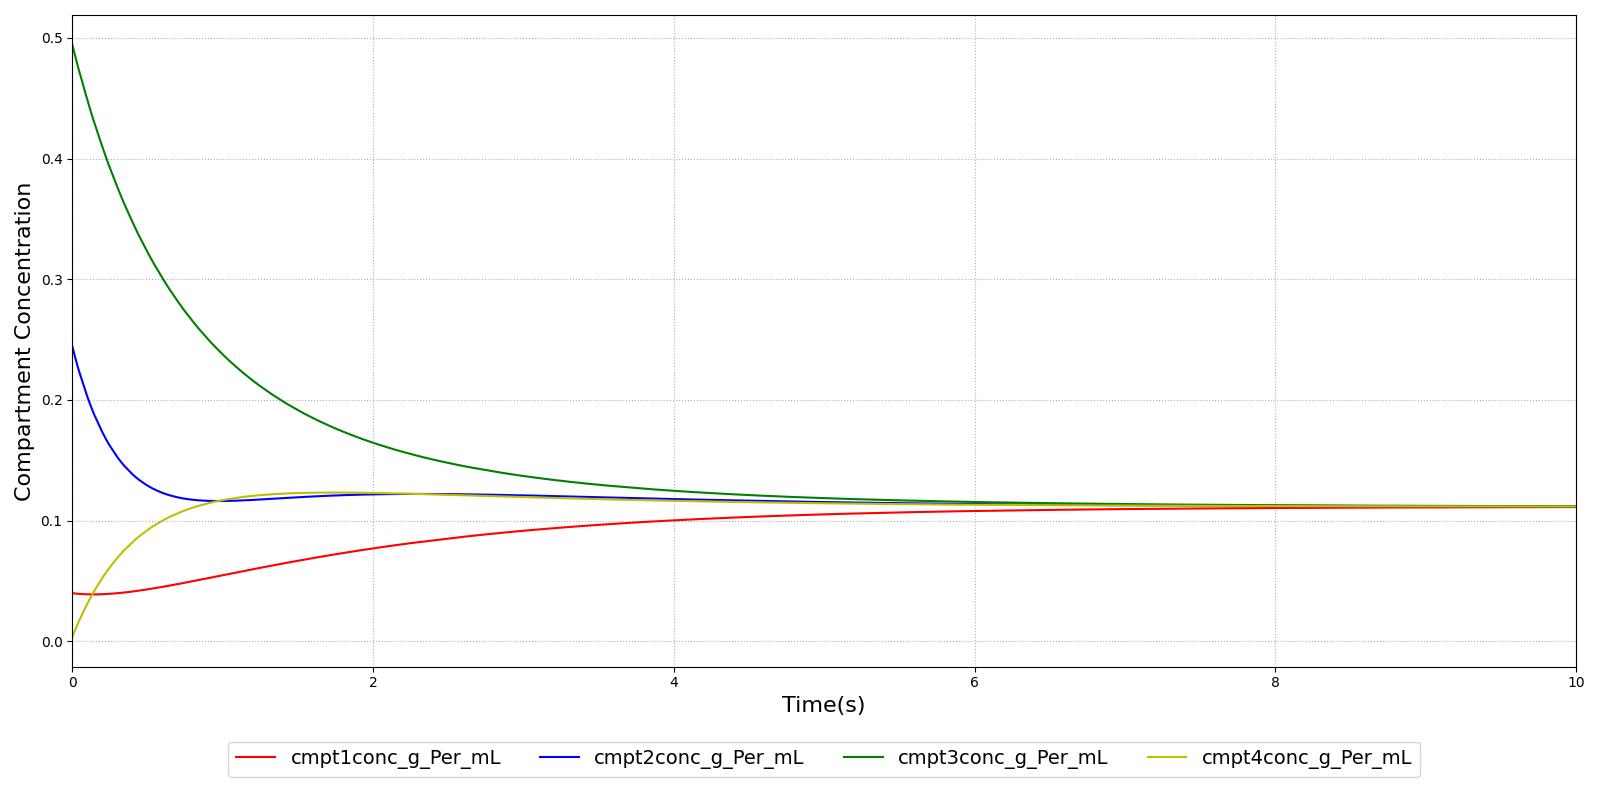
Verification of the diffusion methods is achieved through several units tests. One of the simple diffusion unit tests was used to generate data for Figure 7. The figure shows the time-evolution of the concentrations of four different compartments. Table 3 shows the initial conditions. Note that the units are arbitrary, thus not shown. The red, blue, and green compartment all share a boundary with the yellow compartment, but not with each other.
| Compartment | Volume | Mass | Concentration |
|---|---|---|---|
| Red | 50.0 | 2.0 | 0.04 |
| Blue | 10.0 | 2.5 | 0.20 |
| Green | 20.0 | 10 | 0.50 |
| Yellow | 50.0 | 0.0 | 0.00 |
Validation - Resting Physiologic State
The tissue system volumes are validated using data from [361].
Standard Male
| Property Name | Expected Value | Engine Value | Percent Error | Notes |
|---|---|---|---|---|
| CarbonDioxideProductionRate(mL/min) | 200.0 [148] | Mean of 201.9 | 1% | |
| ExtracellularFluidVolume(mL) | 8830 [295] | Mean of 8811 | -0.2% | Excluding intravascular fluid, sum of compartments |
| ExtravascularFluidVolume(mL) | 34200 [295] | Mean of 34128 | -0.2% | |
| IntracellularFluidPH | [6.0, 7.4] [148] | Mean of 7.0 | Within bounds | |
| IntracellularFluidVolume(mL) | 25400 [295] | Mean of 25317 | -0.3% | Excluding intravascular fluid |
| OxygenConsumptionRate(mL/min) | 250 [148] | Mean of 247 | -1.2% | |
| RespiratoryExchangeRatio | 0.85 [142] | Mean of 0.82 | -3.5% | |
| CarbonDioxide-AlveolarTransfer(mL/min) | -250 [207] | Mean of -186 | -25.6% | |
| Oxygen-AlveolarTransfer(mL/min) | 300 [207] | Mean of 244 | -18.7% |
Standard Female
| Property Name | Expected Value | Engine Value | Percent Error | Notes |
|---|---|---|---|---|
| CarbonDioxideProductionRate(mL/min) | 200.0 [148] | Mean of 155.6 | -22.2% | |
| ExtracellularFluidVolume(mL) | 6680 [295] | Mean of 6735 | 0.8% | Excluding intravascular fluid, sum of compartments |
| ExtravascularFluidVolume(mL) | 23100 [295] | Mean of 23351 | 1.1% | |
| IntracellularFluidPH | [6.0, 7.4] [148] | Mean of 7.0 | Within bounds | |
| IntracellularFluidVolume(mL) | 16400 [295] | Mean of 16616 | 1.3% | Excluding intravascular fluid |
| OxygenConsumptionRate(mL/min) | 250 [148] | Mean of 189 | -24.4% | |
| RespiratoryExchangeRatio | 0.85 [142] | Mean of 0.82 | -3.5% | |
| CarbonDioxide-AlveolarTransfer(mL/min) | -250 [207] | Mean of -149 | -40.4% | |
| Oxygen-AlveolarTransfer(mL/min) | 300 [207] | Mean of 189 | -37% |
Standard Male
| Property Name | Expected Value | Engine Value | Percent Error | Notes |
|---|---|---|---|---|
| FatTissue-TotalVolume(L) | 15.70 [361] | Mean of 15.72 | 0.1% | |
| FatTissueExtracellular-Volume(mL) | 2120.0 [295] | Mean of 2122.0 | 0.1% | |
| FatTissueIntracellular-Volume(mL) | 267.0 [295] | Mean of 267.0 | 0% | |
| BoneTissue-TotalVolume(L) | 8.09 [361] | Mean of 8.08 | -0.1% | |
| BoneTissueExtracellular-Volume(mL) | 809.0 [295] | Mean of 807.0 | -0.2% | |
| BoneTissueIntracellular-Volume(mL) | 2800.0 [295] | Mean of 2795.0 | -0.2% | |
| BrainTissue-TotalVolume(L) | 1.45 [361] | Mean of 1.45 | 0% | |
| BrainTissueExtracellular-Volume(mL) | 235.0 [295] | Mean of 235.0 | 0% | |
| BrainTissueIntracellular-Volume(mL) | 900.0 [295] | Mean of 899.0 | -0.1% | |
| GutTissue-TotalVolume(L) | 1.02 [361] | Mean of 1.02 | 0% | |
| GutTissueExtracellular-Volume(mL) | 288.0 [295] | Mean of 288.0 | 0% | |
| GutTissueIntracellular-Volume(mL) | 485.0 [295] | Mean of 484.0 | -0.2% | |
| RightKidneyTissue-TotalVolume(L) | 0.16 [361] | Mean of 0.15 | -3.2% | |
| RightKidneyTissueExtracellular-Volume(mL) | 42.4 [295] | Mean of 42.0 | -0.9% | |
| RightKidneyTissueIntracellular-Volume(mL) | 75.0 [295] | Mean of 75.0 | 0% | |
| LeftKidneyTissue-TotalVolume(L) | 0.16 [361] | Mean of 0.15 | -3.2% | |
| LeftKidneyTissueExtracellular-Volume(mL) | 42.4 [295] | Mean of 42.0 | -0.9% | |
| LeftKidneyTissueIntracellular-Volume(mL) | 75.0 [295] | Mean of 75.0 | 0% | |
| LiverTissue-TotalVolume(L) | 1.80 [361] | Mean of 1.80 | 0% | |
| LiverTissueExtracellular-Volume(mL) | 290.0 [295] | Mean of 290.0 | 0% | |
| LiverTissueIntracellular-Volume(mL) | 1030.0 [295] | Mean of 1031.0 | 0.1% | |
| RightLungTissue-TotalVolume(L) | 0.26 [361] | Mean of 0.26 | -1.1% | |
| RightLungTissueExtracellular-Volume(mL) | 88.3 [295] | Mean of 88.0 | -0.3% | |
| RightLungTissueIntracellular-Volume(mL) | 117.0 [295] | Mean of 117.0 | 0% | |
| LeftLungTissue-TotalVolume(L) | 0.24 [361] | Mean of 0.24 | 0.8% | |
| LeftLungTissueExtracellular-Volume(mL) | 79.9 [295] | Mean of 80.0 | 0.1% | |
| LeftLungTissueIntracellular-Volume(mL) | 106.0 [295] | Mean of 106.0 | 0% | |
| MuscleTissue-TotalVolume(L) | 29.00 [361] | Mean of 29.00 | 0% | |
| MuscleTissueExtracellular-Volume(mL) | 3430.0 [295] | Mean of 3420.0 | -0.3% | |
| MuscleTissueIntracellular-Volume(mL) | 18300.0 [295] | Mean of 18270.0 | -0.2% | |
| MyocardiumTissue-TotalVolume(L) | 0.33 [361] | Mean of 0.33 | 0% | |
| MyocardiumTissueExtracellular-Volume(mL) | 106.0 [295] | Mean of 106.0 | 0% | |
| MyocardiumTissueIntracellular-Volume(mL) | 151.0 [295] | Mean of 150.0 | -0.7% | |
| SkinTissue-TotalVolume(L) | 3.31 [361] | Mean of 3.30 | -0.3% | |
| SkinTissueExtracellular-Volume(mL) | 1260.0 [295] | Mean of 1261.0 | 0.1% | |
| SkinTissueIntracellular-Volume(mL) | 963.0 [295] | Mean of 960.0 | -0.3% | |
| SpleenTissue-TotalVolume(L) | 0.15 [361] | Mean of 0.15 | 0% | |
| SpleenTissueExtracellular-Volume(mL) | 31.1 [295] | Mean of 31.0 | -0.3% | |
| SpleenTissueIntracellular-Volume(mL) | 87.0 [295] | Mean of 87.0 | 0% |
Standard Female
| Property Name | Expected Value | Engine Value | Percent Error | Notes |
|---|---|---|---|---|
| FatTissue-TotalVolume(L) | 16.00 [361] | Mean of 16.03 | 0.2% | |
| FatTissueExtracellular-Volume(mL) | 2160.0 [295] | Mean of 2163.0 | 0.1% | |
| FatTissueIntracellular-Volume(mL) | 273.0 [295] | Mean of 273.0 | 0% | |
| BoneTissue-TotalVolume(L) | 5.90 [361] | Mean of 6.00 | 1.7% | |
| BoneTissueExtracellular-Volume(mL) | 590.0 [295] | Mean of 600.0 | 1.7% | |
| BoneTissueIntracellular-Volume(mL) | 2040.0 [295] | Mean of 2076.0 | 1.8% | |
| BrainTissue-TotalVolume(L) | 1.28 [361] | Mean of 1.30 | 1.6% | |
| BrainTissueExtracellular-Volume(mL) | 207.0 [295] | Mean of 211.0 | 1.9% | |
| BrainTissueIntracellular-Volume(mL) | 792.0 [295] | Mean of 806.0 | 1.8% | |
| GutTissue-TotalVolume(L) | 0.94 [361] | Mean of 0.96 | 1.8% | |
| GutTissueExtracellular-Volume(mL) | 266.0 [295] | Mean of 271.0 | 1.9% | |
| GutTissueIntracellular-Volume(mL) | 448.0 [295] | Mean of 456.0 | 1.8% | |
| RightKidneyTissue-TotalVolume(L) | 0.14 [361] | Mean of 0.14 | 3.7% | |
| RightKidneyTissueExtracellular-Volume(mL) | 36.9 [295] | Mean of 38.0 | 3% | |
| RightKidneyTissueIntracellular-Volume(mL) | 65.3 [295] | Mean of 66.0 | 1.1% | |
| LeftKidneyTissue-TotalVolume(L) | 0.14 [361] | Mean of 0.14 | 3.7% | |
| LeftKidneyTissueExtracellular-Volume(mL) | 36.9 [295] | Mean of 38.0 | 3% | |
| LeftKidneyTissueIntracellular-Volume(mL) | 65.3 [295] | Mean of 66.0 | 1.1% | |
| LiverTissue-TotalVolume(L) | 1.38 [361] | Mean of 1.40 | 1.4% | |
| LiverTissueExtracellular-Volume(mL) | 222.0 [295] | Mean of 225.0 | 1.4% | |
| LiverTissueIntracellular-Volume(mL) | 788.0 [295] | Mean of 802.0 | 1.8% | |
| RightLungTissue-TotalVolume(L) | 0.26 [361] | Mean of 0.22 | -14.7% | |
| RightLungTissueExtracellular-Volume(mL) | 86.7 [295] | Mean of 74.0 | -14.6% | |
| RightLungTissueIntracellular-Volume(mL) | 115.0 [295] | Mean of 98.0 | -14.8% | |
| LeftLungTissue-TotalVolume(L) | 0.20 [361] | Mean of 0.20 | 2% | |
| LeftLungTissueExtracellular-Volume(mL) | 65.9 [295] | Mean of 67.0 | 1.7% | |
| LeftLungTissueIntracellular-Volume(mL) | 87.4 [295] | Mean of 89.0 | 1.8% | |
| MuscleTissue-TotalVolume(L) | 17.20 [361] | Mean of 17.50 | 1.7% | |
| MuscleTissueExtracellular-Volume(mL) | 2030.0 [295] | Mean of 2064.0 | 1.7% | |
| MuscleTissueIntracellular-Volume(mL) | 10800.0 [295] | Mean of 11025.0 | 2.1% | |
| MyocardiumTissue-TotalVolume(L) | 0.25 [361] | Mean of 0.25 | 1.6% | |
| MyocardiumTissueExtracellular-Volume(mL) | 78.6 [295] | Mean of 80.0 | 1.8% | |
| MyocardiumTissueIntracellular-Volume(mL) | 112.0 [295] | Mean of 114.0 | 1.8% | |
| SkinTissue-TotalVolume(L) | 2.27 [361] | Mean of 2.30 | 1.3% | |
| SkinTissueExtracellular-Volume(mL) | 869.0 [295] | Mean of 879.0 | 1.2% | |
| SkinTissueIntracellular-Volume(mL) | 662.0 [295] | Mean of 669.0 | 1.1% | |
| SpleenTissue-TotalVolume(L) | 0.13 [361] | Mean of 0.13 | 1.6% | |
| SpleenTissueExtracellular-Volume(mL) | 26.4 [295] | Mean of 27.0 | 2.3% | |
| SpleenTissueIntracellular-Volume(mL) | 74.0 [295] | Mean of 75.0 | 1.4% |
More validation of this system can be found in the system outputs of all other systems, e.g., the oxygen and carbon dioxide saturation, the blood pH, and the bicarbonate concentration values are found in the Blood Chemistry Methodology and the alveoli oxygen and carbon dioxide partial pressures are found in the Respiratory Methodology.
Validation - Actions and Conditions
There are currently no validated actions or conditions associated with the tissue system. However, there will be condition validation after improvements are made to the dehydration and starvation condition models.
Future Work
Coming Soon
- Improved blood glucose and blood triglyceride dynamic model
- Albumin transport model to affect blood albumin concentration based on hepatic production
Recommended Improvements
- Permeability-limited diffusion model
- Endogenous carbon monoxide production
Appendices
Data Model Implementation
Compartments
- Bone
- BoneExtracellular
- BoneIntracellular
- Brain
- BrainExtracellular
- BrainIntracellular
- Fat
- FatExtracellular
- FatIntracellular
- Gut
- GutExtracellular
- GutIntracellular
- LeftKidney
- LeftKidneyExtracellular
- LeftKidneyIntracellular
- LeftLung
- LeftLungExtracellular
- LeftLungIntracellular
- Liver
- LiverExtracellular
- LiverIntracellular
- Muscle
- MuscleExtracellular
- MuscleIntracellular
- Myocardium
- MyocardiumExtracellular
- MyocardiumIntracellular
- RightKidney
- RightKidneyExtracellular
- RightKidneyIntracellular
- RightLung
- RightLungExtracellular
- RightLungIntracellular
- Skin
- SkinExtracellular
- SkinIntracellular
- Spleen
- SpleenExtracellular
- SpleenIntracellular
- Lymph