Overview
Abstract
The Respiratory System supplies oxygen and removes waste carbon dioxide from the body through a combination of ventilation and gas exchange across the blood-gas barrier (pulmonary capillary-alveoli interface). The Respiratory System is designed to model the ventilatory behavior (both positive- and negative-pressure) of the patient Respiratory System using electrical analogue lumped parameter models. The Respiratory Model employs realistic pressure source signal and chemical stimuli feedback mechanisms as drivers for spontaneous ventilation. The model handles several patient conditions, including tension pneumothorax and airway obstruction. The majority of the lung values investigated for the overall model matched the validation data found in publications. Patient conditions also showed strong agreement with clinically significant output parameters, i.e., respiration rate, oxygen saturation, heart rate, and blood pressure.
Introduction
Respiratory Physiology
The human Respiratory System consists of the upper airways (region above the cricoid cartilage), the lower airways, the lungs, and the respiratory muscles. The lower airways begin at the trachea and extend to the bronchi, bronchioles, and the alveoli. At the carina, the trachea divides into two mainstem bronchi, the right and left. The bronchi bifurcate into smaller bronchioles that continue branching for up to 23 generations, forming the tracheobronchial tree that terminates with the alveoli. Alveolar ducts and alveolar sacs are the operating units of the lungs where gas exchange occurs with the pulmonary capillaries. The first several generations of airways, where no gas exchange occurs, constitute the anatomic dead space and are referred to as the conducting zone. In contrast, alveolar ducts and sacs that terminate the tracheobronchial tree are referred to as the respiration zone.
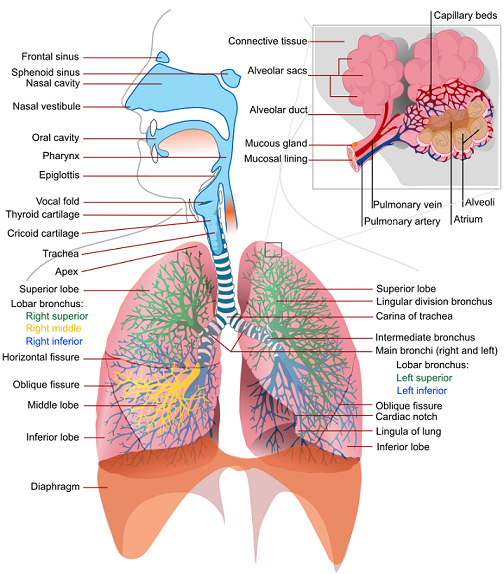
The alveolar-capillary gas exchange is facilitated by the ventilation process, which is driven by the intercostal muscles, the diaphragm, and the chest wall recoil. These mechanisms work in tandem to actively drive fresh air into the lungs and passively remove gases from the lungs. Attached to the chest wall is a thin layer of membrane (pleura) that folds back onto itself, forming two layers, known as the visceral and parietal pleurals. The pleural cavity is filled with fluid. The pressure in this space, known as the intrapleural pressure, is normally slightly below the atmospheric pressure. Even when no inspiratory muscles are contracting, the mechanical interaction between the lung and the chest wall pulls the two pleural membranes apart, resulting in a slightly decreased intrapleural pressure (-3 cm H2O to -5 cm H2O) [207] .
Mathematical Model
Mathematical modeling of the respiratory physiology dates back to the work published by Gray in 1945 [135] . Gray provided the first mathematical description for the chemical control of pulmonary ventilation. Later, Gordins et al. developed the first dynamic model of the respiratory system in 1954 [140] . Several mathematical models followed after that, including the work by Guyton and collaborators in 1965 [230] and others ( [141] , [184] , [313] , [352] ). Many of the published models describe a specific aspect of the respiratory physiology in considerable detail. To name a few, Lorandi et al. [213] employed a mathematical model to describe the mechanical properties of the lungs, Murray et al. [237] described the gas exchange properties of the lungs, Wiberg et al. [381] and Bache et al. [22] described the effect of higher levels of CO2 or anesthetic gases on breathing, and Whipp et al. [378] developed a mathematical model to describe the respiratory anaerobiosis in skeletal muscle.
Many mathematical models of mechanical ventilation employ the lumped parameter model that represents the entire ventilation process with a small number of unknowns. The simplest lumped parameter model of mechanical ventilation assumes the conducting zone can be identified with a pipe that connects a collection of alveoli to the atmosphere and exerts pneumatic resistance to the flow. This type of model can be solved with a low computational cost, which reduces runtime. For whole body models/simulations, this is an important requirement. The disadvantage of lumped parameter models can lie in the large number of parameters that can result from required circuit parameters. It is important to identify the key features and behaviors of any model to intelligently reduce the number of required parameters.
The most important parameters in the lumped parameter model of mechanical ventilation correspond to the elastic behavior of the lung and the flow resistance of the airways. The thoracic cage and the lung tissue exhibit an elastic behavior that can be represented with a single compliance or multiple compliances. The compliance C is calculated by taking the ratio of the volume δV and the pressure δP variations as:
![\[C=\frac{\delta V}{\delta P} \]](form_146.png)
As a first-order approximation, the volume of the functional unit can be approximated as:
![\[V(P+\delta P)=V(P)+C\delta P\]](form_147.png)
In the Respiratory System, the main source of flow resistance arises from the flow of air through the branches in the conducting zone. Mathematical models using the lumped parameter model select functional units for these regions and designate the variable R for pneumatic flow resistance. The pressure drop ΔP across the respiratory tree can thus be calculated by using Ohm's law analogue as
![\[\Delta P=RQ\]](form_148.png)
where Q is the volumetric flow rate. The above relation assumes the flow is laminar and the gas is incompressible. For laminar, viscous, and incompressible flow, the Hagen-Poiseuille equation relates the pressure drop ΔP in a fluid flowing through a cylindrical pipe of length l and radius r as
![\[\Delta P=\frac{8\mu l}{\pi r^{4} } Q\]](form_149.png)
where Μ is the dynamic viscosity. By defining the flow resistance R as
![\[R=\frac{8\mu l}{\pi r^{4} } \]](form_150.png)
a relation analogous to Ohm's law can be derived.
System Design
Background and Scope
Previous Research
The Respiratory Model has its roots in the mathematical model of Yashuri Fukui and N. Ty Smith [124] . The researchers developed a lumped parameter mathematical model to describe the uptake and distribution of halothane. Their Respiratory Model consisted of two pulmonary compartments corresponding to the dead space and the alveoli [124]. The Respiratory Model in the engine is an extension of the work by Fukui and Smith. This model was developed and released by Advanced Simulation Corporation as part of the simulator, Body Simulation for Anesthesia™. This later formed the backbone of the HumanSim™ physiology engine [278] . The basic elements of the legacy Respiratory System were advanced by the BioGears program before being forked and further developed and improved to allow realistic mechanical responses to pathological conditions.
Approach
The current version of the Respiratory Model represents the two lungs and associated airways as five major functional units, or compartments, that are designated as the carina, right and left anatomic dead space, and right and left alveoli. In the model, the carina compartment represents the anatomical region from the airway at the trachea. The right and left anatomic dead space compartments represent the bronchi and their branching bronchioles that are part of the conducting airways below the carina. The right and left alveoli compartments correspond to the collection of alveoli where gas exchange occurs between the airways and the Cardiovascular System. The right and left chest wall compartments represent the right and left sides of the thoracic wall. The new model additionally accounts for the pleural cavity through circuit elements that allow flow into the pleural space in the event of respiratory insults that involve gas leak either from the alveoli or the thoracic wall. To account for flow through the esophagus, an incidence that may occur during mechanical ventilation (positive-pressure ventilation), the model provides subordinate compartments representing the esophageal passage and the stomach. The model also consists of a pressure signal generator representing the respiratory muscle pressure source driver.
Data Flow
The Respiratory System determines its state at every time step through a three step process: Preprocess, Process, and Postprocess. In general, Preprocess determines the circuit element values based on feedback mechanisms and engine settings/actions. Process uses the generic circuit calculator to compute the entire state of the circuit and fill in all pertinent values. Postprocess is used to advance time.
Initialize
At the beginning of a simulation, patient parameters are used to modify the muscle (pressure source) driver functionality to achieve the specified values at the end of the resting stabilization period - see the Patient Variability section for more details. After resting stabilization is achieved, any user-selected conditions are implemented to reach a new homeostatic point - see the Conditions section for more details.
Preprocess
Update Compliances
The chest wall compliances of the left and right pleural space are modified as a function of volume.
Process Actions and Conditions
There are several methods that modify respiratory parameters based on insults and interventions. This includes combined effects that change deadspace volumes, airway and bronchi resistances, alveolar compliances, inspiratory-espiratory ratios, diffusion surface area, pulmonary capillary resistance, aerosol deposition, and air leaks.
Respiratory Driver
The respiratory muscle pressure source that drives spontaneous ventilation is calculated based on chemical stimuli feedback control mechanism.
Process
The generic circuit methodology developed for the engine is used to solve for the pressure, flow, and volume at each node or path. For more details on this, see the Circuit Methodology. Substance volumes and volume fractions (concentrations) are also calculated during this step. See the Substance Transport Methodology for more details.
The Calculate Vital Signs function uses the circuit pressure, flow, and volume to calculate important system-level quantities for the current time step.
Postprocess
The Postprocess step moves values calculated in the Process step from the next time step calculation to the current time step calculation. This allows all other systems access to the information when completing their Preprocess analysis during the next time step.
Features and Capabilities
Respiratory Circuit
The Respiratory System designates a set of functional elements, or compartments, to model mechanical ventilation. The functional elements are represented by an electric analogue circuit comprised of resistors, capacitors, switches, diodes, and power sources. The latter represents the driving pressure from the respiratory muscles. The resistors and capacitors represent the resistance to flow through the airways and the elastic nature of the airways, alveoli, and thoracic walls.
The equivalent of an electric switch is used to transition between different ventilation conditions or flow pathways. For example, the electric analogue switch accounts for incidents that permit flow through the esophageal tract while prohibiting flow through the trachea. Unidirectional flow in the respiratory system is handled through electric analogue diodes that allow flow in one direction, preventing flow in the opposite direction. Such functional elements are employed to represent insults that allow unidirectional gas flow into the pleural cavity through an opening at the alveoli or the thoracic wall.
In the circuit model, the carina and right and left dead spaces are represented by resistors to account for pneumatic resistance that impedes flow of gas across the conducting zones. Each of the right and left alveoli compartments are represented by a combination of resistors and capacitors (compliances) to account for the elastic behavior of the alveoli. The right and left chest wall compartments are represented by variable compliance that allows flexibility to mechanical insults. Based on the electrical circuit analogue, the model predicts the dynamic properties of the Respiratory System. Figure 2 depicts the network of respiratory circuit elements and their interconnections.
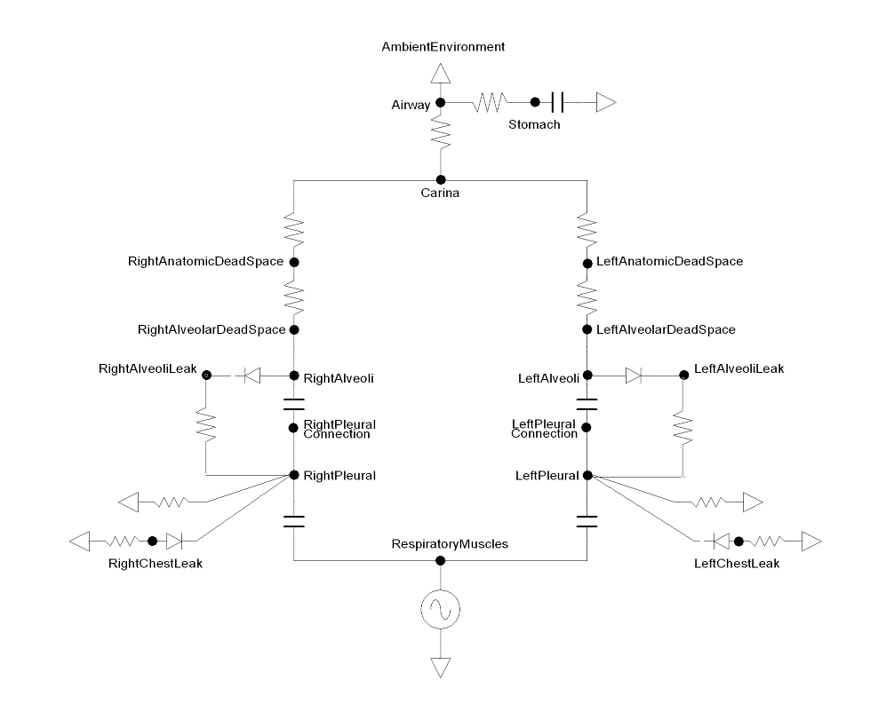
The respiratory circuit employs circuit nodes and paths to represent physiological state variables belonging to the Respiratory System's functional units. In this representation, the pressures across the compartmental units are designated to the nodes, while all other variables (flow, volume, hydraulic resistances, and compliances) are assigned to the paths on the circuit. At any instant of time, the flow Q on a path across a resistor R can be calculated using the pressure difference ΔP between the nodes across the path as Q=ΔP/R. Similarly, the volume change ΔV of a respiratory element with compliance C can be calculated based on the pressure difference ΔP between the nodes connected by the path as ΔV=CΔP. The time evolution of the pressures at each node in the circuit is solved using the Circuit Solver as described in the Circuit Methodology.
Patient Variability
Several patient parameters are set/calculated outside of the Respiratory System at the beginning of a simulation (See Patient Methodology). The patient parameters that are used as inputs to the Respiratory System are:
- Respiration Rate Baseline: used to set the driver frequency
- Functional Residual Capacity: used to set the driver default pressure
- Total Lung Capacity: used to set the driver maximum allowable pressure
- Right Lung Ratio: used in the scaling equation for inspiratory-expiratory ratio for conditions
- Basal Metabolic Rate: used for metabolic effects
- Vital Capacity: used to determine the tidal volume plateau in the driver piecewise target alveolar ventilation function
Several patient parameters are updated at the end of each stabilization segment (Resting, Conditions, and Feedback). This allows the simulation to reach new homeostatic points that take into account the whole-body state based on both internal and external factors. The patient parameters that are reset by the Respiratory System are:
- Respiration Rate Baseline: from Respiration Rate system data value
- Tidal Volume Baseline: from Tidal Volume system data value
- Functional Residual Capacity: from calculated instantaneous value
- Vital Capacity: calculated as [TLC - RV]
- Expiratory Reserve Volume: calculated as [FRC - RV]
- Inspiratory Reserve Volume: calculated as [TLC - FRC - TV]
- Inspiratory Capacity: calculated as [TLC - FRC]
The patient Alveoli Surface Area is also modified when condition/action effects are applied.
Feedback
Driver Pressure Source
The Respiratory System interacts with other systems in the engine to receive feedback and adjust spontaneous breathing for homeostasis. To accurately model the respiratory response under various physiological and pathological conditions, a robust Respiratory Model that responds to mechanical stresses and chemical stimuli is required. To this end, the engine Respiratory System employs a time-dependent pressure source based on a chemical feedback mechanism that mimics the respiratory response to blood gas levels as sensed by the central and peripheral chemoreceptors. The pressure source represents the muscle effort and serves as an input power source to drive the inspiration and expiration phases of the breathing cycle.
During inhalation, the driver pressure source is set to a negative value. The end of the exhalation cycle represents the initial conditions of free breathing, where the alveolar pressure equals the atmospheric pressure and no air flows into the lungs. When the inspiratory muscles are not contracting, the mechanical interaction between the lungs and the chest wall creates a subatmospheric intrapleural pressure. The value of the driver pressure in the model is selected to meet the unstressed condition at the pleural node. In the case of mechanical ventilation, the anesthesia machine controls the pressure at the airway node for positive pressure ventilation. More details on positive pressure ventilation can be found in the Anesthesia Machine Methodology.
For a realistic muscle pressure source signal, the Respiratory System adopted a piecewise logarithmic mathematical model for each lung based on clinical data. The single breath waveform segments are defined by fraction of total breath and are broken out by the following segments:
- Inspiratory rise
- Inspiratory hold
- Inspiratory released
- Inspiratory to expiratory pause
- Expiratory rise
- Expiratory hold
- Expiratory release
- Residue
Each segment is given as a fraction of the total breath, with all summing to a value of 1 whole breath. The inpsiratory rise (inhale) period (segment 1: Tins) and inspiratory release (exhale) period (segment 3: Texp) is calculated as a fraction of the total breath period (Ttot) knowing the muscle driver ventilation frequency (fv) by [123],
![\[\frac{{{T_{ins}}}}{{{T_{tot}}}} = 0.0125\left( {{f_v}[bpm] + 4} \right) + 0.125\]](form_151.png)
![\[\frac{{{T_{\exp }}}}{{{T_{tot}}}} = {T_{tot}} - {T_{ins}}\]](form_152.png)
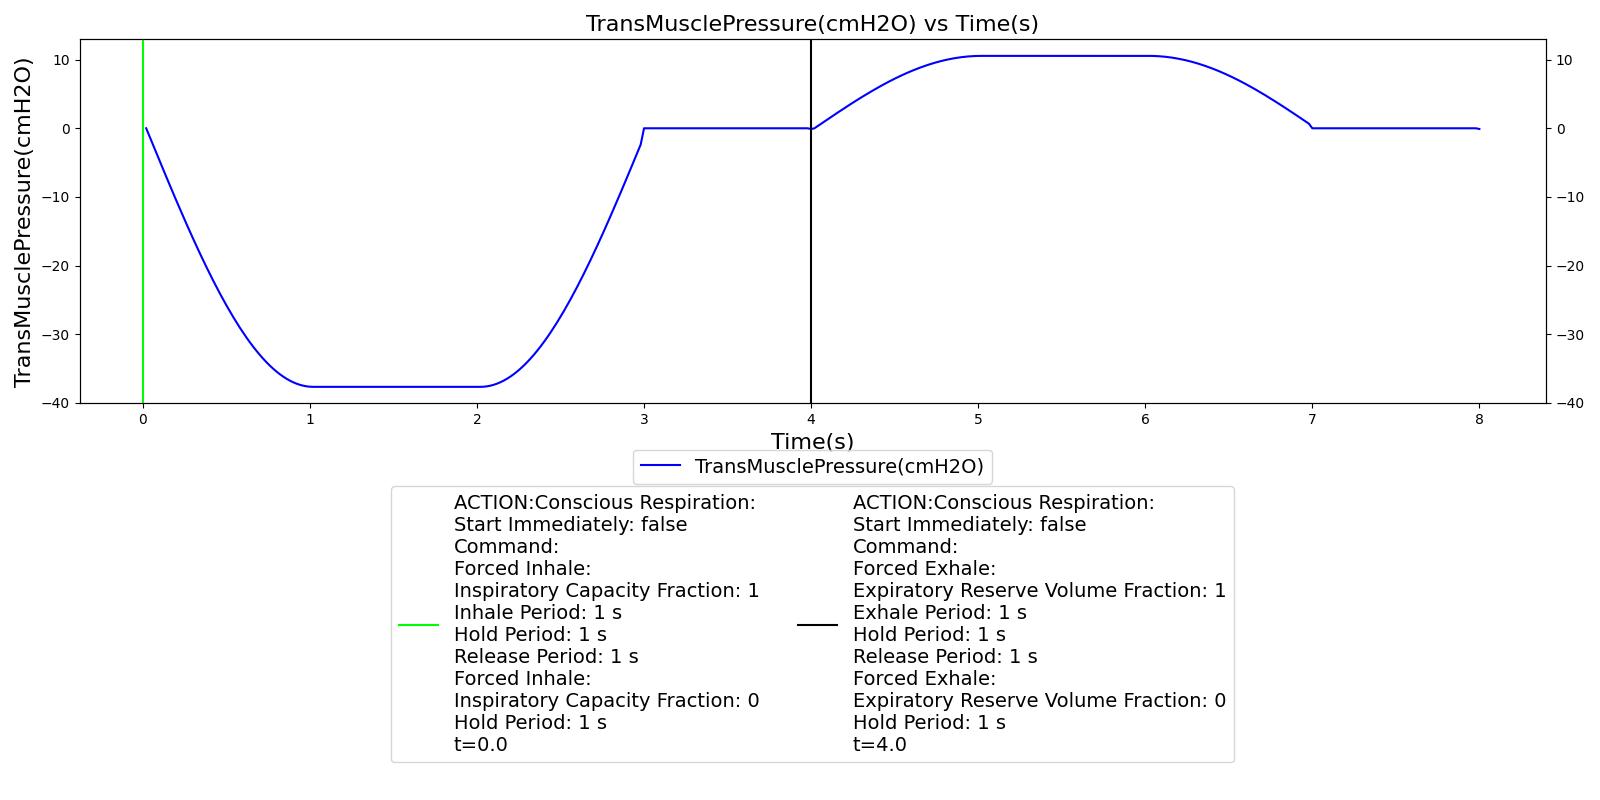
Unless a conscious respiration action is called, all other segment fractions are set to 0. The inspiratory-expiratory ratio will change based on the driver respiration rate. The time series(t) of the respiratory muscle pressure (Pmus) is based on empirical data [194] as,
![\[{P_{mus}} = \left\{ {\begin{array}{*{20}{l}}
{{P_{\min }} \cdot \sin \left( {\frac{\pi }{2} \cdot \frac{t}{{{t_1}}}} \right),}&{0 < t \le {t_1}}\\
{{P_{\min }},}&{{t_1} < t \le {t_2}}\\
{{P_{\min }} \cdot \sin \left( {\frac{\pi }{2} \cdot \frac{{t + {t_3} - 2{t_2}}}{{{t_3} - {t_2}}}} \right),}&{{t_2} < t \le {t_3}}\\
{0,}&{{t_3} < t \le {t_4}}\\
{{P_{max}} \cdot \sin \left( {\frac{\pi }{2} \cdot \frac{{t - {t_4}}}{{{t_5} - {t_4}}}} \right),}&{{t_4} < t \le {t_5}}\\
{{P_{max}},}&{{t_5} < t \le {t_6}}\\
{{P_{max}} \cdot \sin \left( {\frac{\pi }{2} \cdot \frac{{t + {t_7} - 2{t_6}}}{{{t_7} - {t_6}}}} \right),}&{{t_6} < t \le {t_7}}\\
{0,}&{{t_7} < t \le {t_{\max }}}
\end{array}} \right.\]](form_153.png)
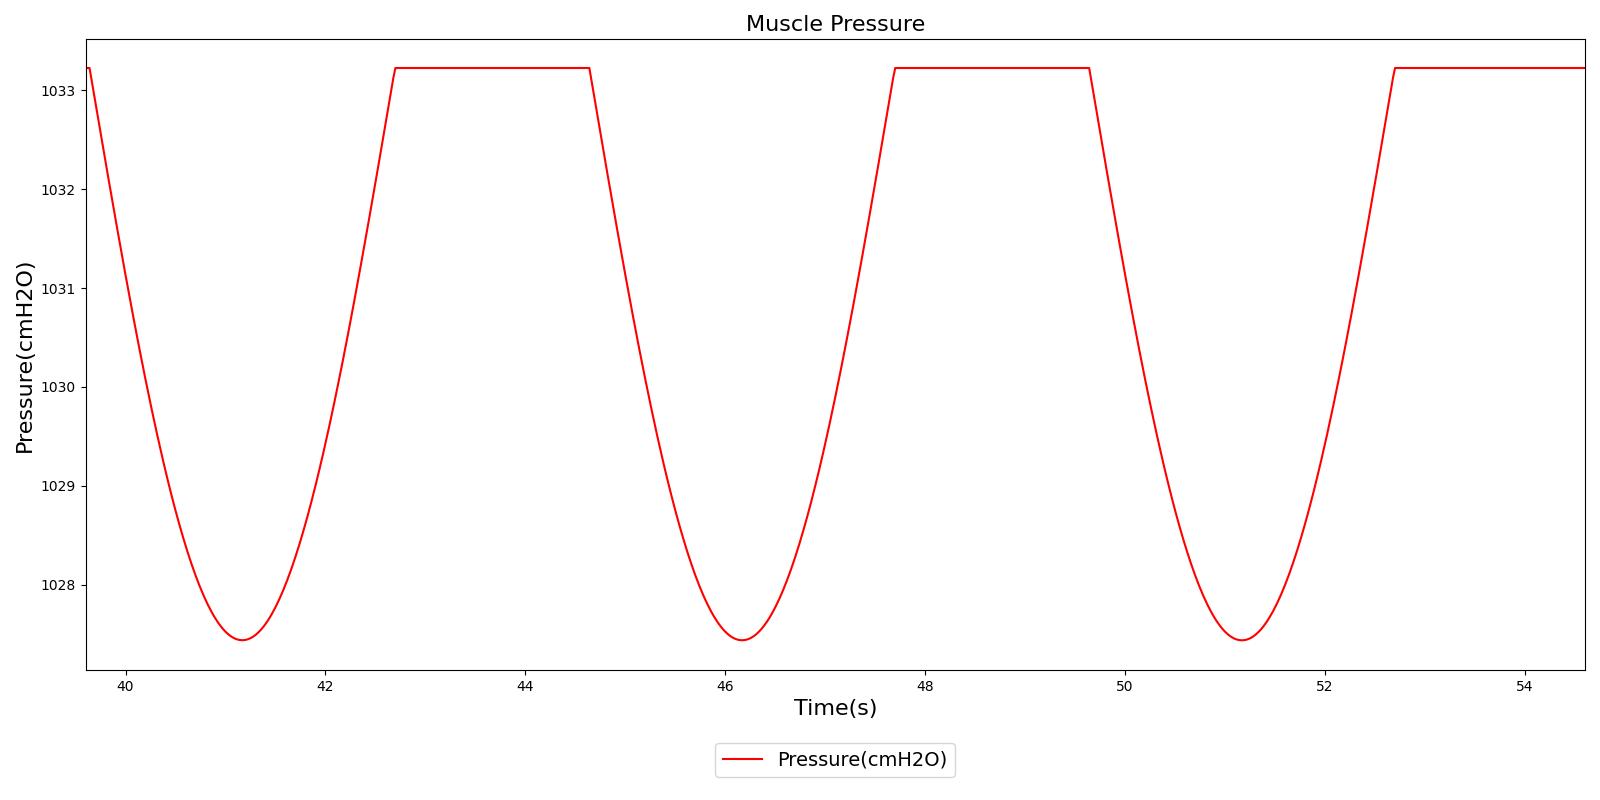
Where Pmin is the largest negative pressure value during inhalation and Pmax is the largest positive pressure value during exhalation, the combination of which specifies the amplitude of the pressure source signal. Each time value (t with a subscript) is determined using set fractions and the total breath time to achieve the desired inspiratory-expiratory ratio. Figure 3 shows the basic segmented muscle driver waveform used.
At the beginning of each breath, a target volume (i.e., tidal volume) is determined and mapped to the Pmin value using simple circuit math and assuming constant lung and chest wall compliances. This is given by,
![\[{P_{min }} = \frac{{ - V + FRC}}{{{C_{total}}}}\]](form_154.png)
Where V is the target volume, FRC is the functional residual capacity and Ctotal is the total compliance of the respiratory system. The total compliance is determined from the baseline constant compliances of the left chest wall (CLCW), left lung (CLL), right chest wall (CRCW), and right lung (CRL) by,
![\[{C_{total}} = \frac{1}{{\frac{1}{{{C_{LCW}}}} + \frac{1}{{{C_{LL}}}}}} + \frac{1}{{\frac{1}{{{C_{RCW}}}} + \frac{1}{{{C_{RL}}}}}}\]](form_155.png)
The Fresnel model uses pre-selected ventilation frequencies to model various physiological and pathological conditions. The Respiratory System extended the Fresnel, et. al. model by incorporating a chemical stimuli feedback mechanism that contributes to the overall blood gas regulation. As a chemical feedback mechanism, past works used empirical relationships between minute ventilation, V.E, or alveolar ventilation, V.A, and the blood gas partial pressures that represent the respiratory response to chemical stimuli at the peripheral and central chemoreceptors [185] , [28] . The Respiratory Model adopted the mathematical relation that links the alveolar ventilation with the blood gas levels. The resulting mathematical relationship implemented in the Respiratory System is
![\[\dot{V}_{A} =G_{p} e^{-0.05P_{a} O_{2} } \max (0,P_{aCO_{2} } -I_{p} )+G_{c} \max (0,P_{aCO_{2} } -I_{c} )\]](form_156.png)
PaO2 and PaCO2 are the arterial oxygen and carbon dioxide partial pressures, respectively. Ip and Ic are the cutoff threshold constants, and Gp and Gc are the peripheral and central controller gain constants, respectively. The value of fv used in the pressure source corresponds to the target respiration rate that the engine must attain to ensure accurate blood gas levels. It is related to the minute ventilation, V.E, as shown in the equation below
![\[f_{v} =\dot{V}_{E} /V_{T} \]](form_157.png)
where V.E is calculated using the relation
![\[\dot{V}_{E} =\dot{V}_{A} +\dot{V}_{D} \]](form_158.png)
V.D is the dead space ventilation and is obtained by taking the product of the dead space volume and the respiration rate. The target tidal volume VT needed to predict fv is calculated from the pulmonary ventilation based on a piecewise linear relationship between the tidal volume and the minute ventilation as shown by Watson [374] . In the article, the author presented data that describes the relationship between the minute ventilation and tidal volume by straight line. The data is reproduced in Figure 4 below.
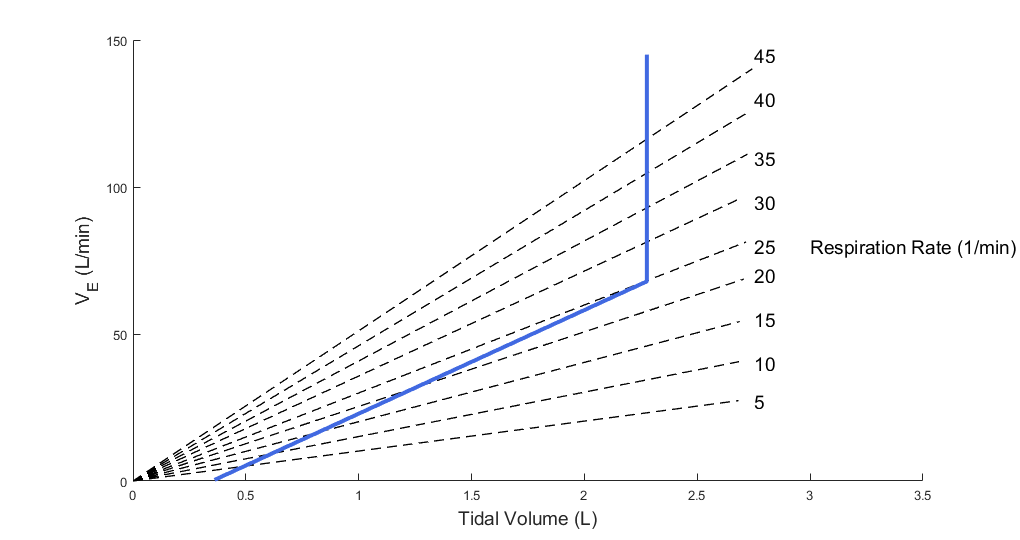
The data in the article shows that the minute ventilation can be described by two intersecting straight lines. Up to about half of the vital capacity VC, the minute ventilation,
V.E, and the tidal volume, VT, are related as
![\[\dot{V}_{E} =m(V_{T} -c)\]](form_159.png)
where m is the slope and c is the x-intercept of the minute ventilation versus tidal volume plot. The data shows that the minute ventilation is constant above half of the vital capacity. Based on this observation, the Respiratory Model employs the linear relation given below to predict the target tidal volume from the minute ventilation.
![\[V_{T} =\left\{\begin{array}{l} {c+\dot{V}_{E} /m,V_{T} \le V_{C} } \\ {0.5*V_{C} ,V_{T} >V_{C} } \end{array}\right. \]](form_160.png)
Where m and c are constant parameters determined during initialization. During the initial parameterization, the minute ventilation is plotted against the vital capacity to determine c by taking the x-intercept of V.E vs VT plot. Then, the slope is adjusted to meet the initial baseline parameters of the patient. These parameters include the baseline respiration rate and tidal volume, where the latter is estimated from the patient's weight.
Once m and c are selected this way, they are used as patient parameters for determining the target tidal volume from the minute ventilation that is determined by the feedback mechanism. This provides the target tidal volume that must be attained to respond to the chemical stimuli feedback. This value is then communicated back to the target ventilation frequency fv, which in turn adjusts the patient's breathing frequency through the muscle pressure. The muscle pressure then drives sufficient gas into the lungs in response to the chemical stimuli, completing the feedback loop.
In the calculation of the target tidal volume, the Respiratory Model allows the target tidal volume to increase linearly with the calculated minute ventilation as long as the target volume is below half the vital capacity. In the event that the calculated target volume is above half of the vital capacity, the target volume is set to a constant value of 0.5VC as shown in the above equation. In the model, the lung vital capacity VC is calculated from the patient's total lung capacity and residual volume as described in the sections below.
The model described above is implemented in the engine with reference values and model parameters that are tuned to meet validation data. The reference and tuned values for the model parameters are shown in Table 1 below. Note that our model is tuned to use the reference values without modification.
| Parameter (units) | Reference Value | Model Value |
|---|---|---|
| Gp | 30.24 [28] | 30.24 |
| Gc | 1.44 [28] | 1.44 |
| Ip, Ic(mmHg) | 35.5 [28] | 35.5 |
| P0.1(cmH2O) | 0.75 [50] | 0.75 |
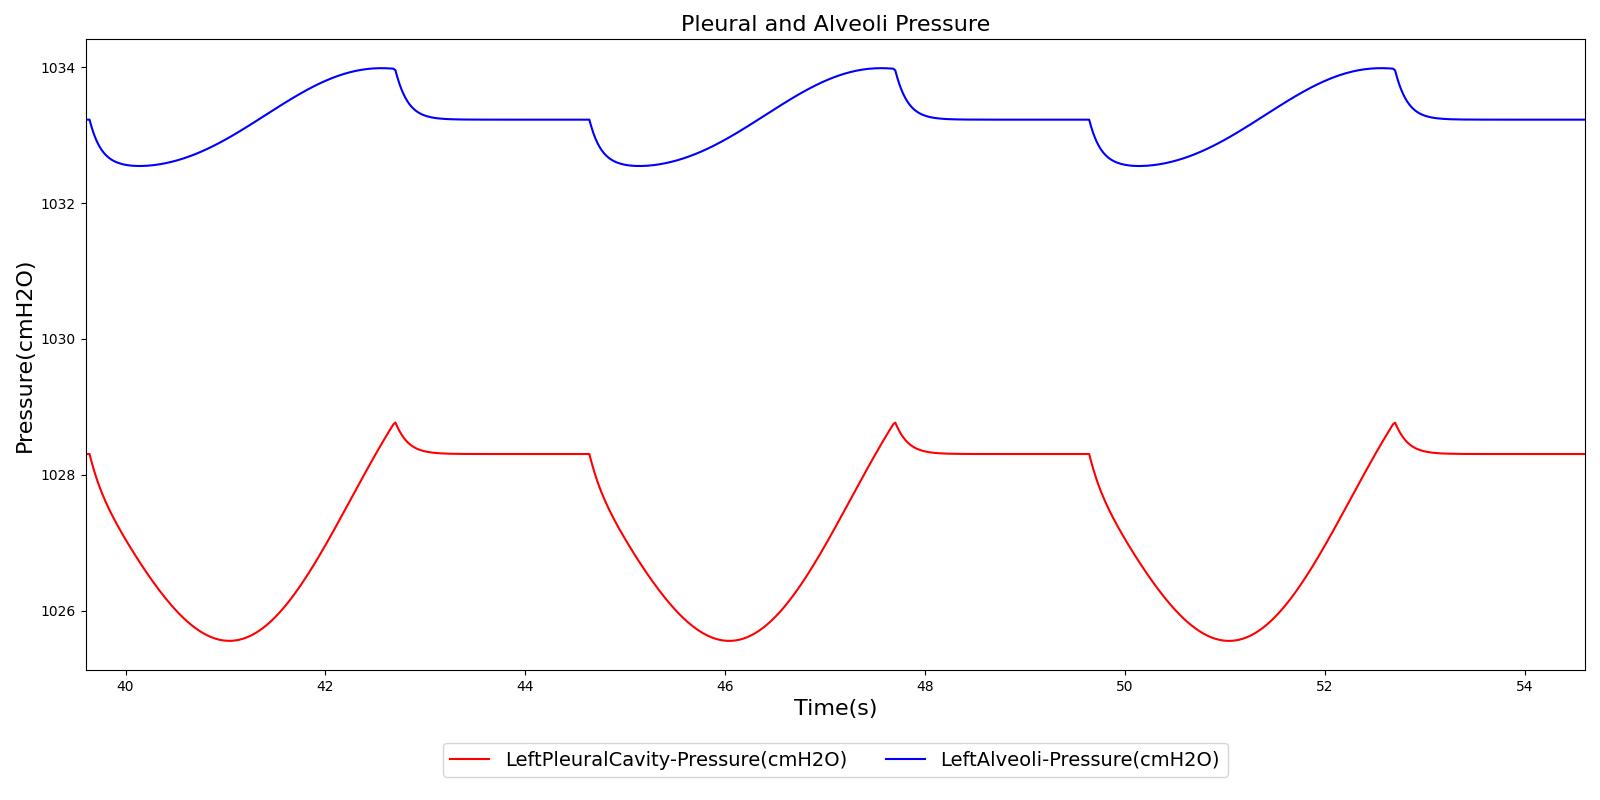
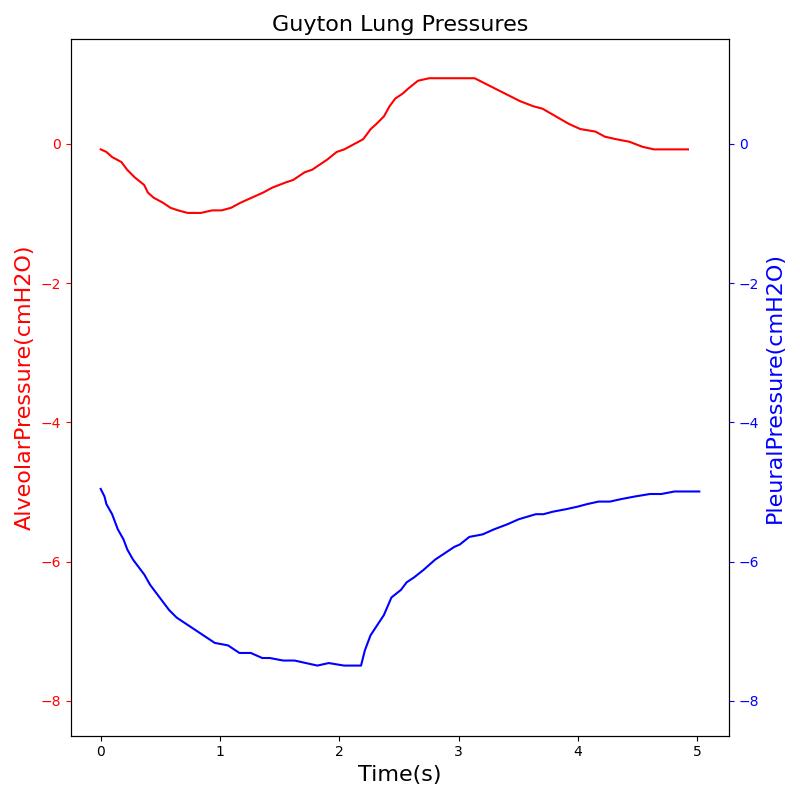
Figure 5 depicts the time-dependent driver pressure source of the Respiratory System as obtained during simulation of the standard patient model of the engine (77 kg adult male) under normal physiological conditions. For comparison, the driver pressure is plotted with the alveolar, intrapleural, and transpulmonary pressures. The figure shows the pressures for several breathing cycles. The model driver pressure exhibits distinct waveforms during the inspiration and expiration phases. These patterns represent the active distension and passive relaxation behaviors of the inspiratory muscles. As a result of such input, the model distinguishes between the active inspiratory and passive expiratory phases of the breathing cycle. The time-dependent muscle pressure together with the atmospheric pressure and the compliances act in tandem to generate the pleural and alveolar pressure waveforms shown in the figure.
 |
 |
Compliances
The Pulse respiratory system is separated into four compliances (see the circuit diagram in Figure 6) defined by the left and right chest walls and lungs. The pressure-volume relationship has been well studied in describing the mechanical behavior of the lungs during inflation and deflation [155]. A comprehensive sigmoidal equation for the entire system has been determined from empirical pulmonary pressure-volume data [368]. This compliance curve has been further broken into two constant values for the left and right lung curves and two sigmoidal functions for the left and right lungs. Figure 6 shows the right side (combined chest wall and lung) compliance curve for the healthy standard patient. This function is varied based on patient settings. During simulations, the instantaneous compliances based on this curve are determined using the current lung volume.
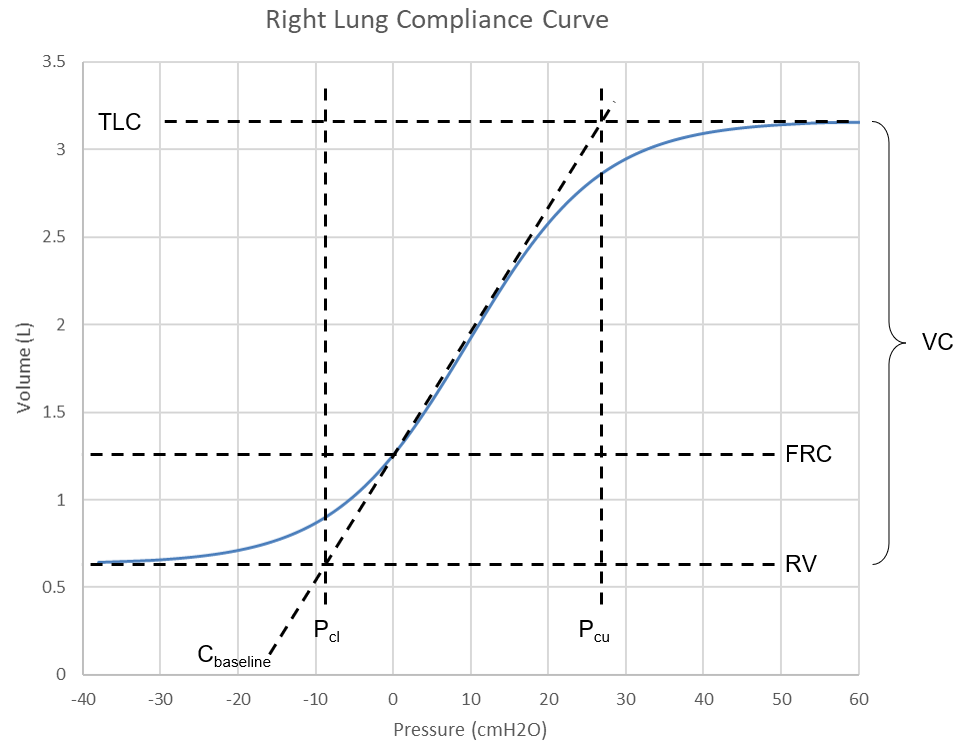
The waveform in Figure 6 is defined by these mathematical relationships,
![\[V = RV + \frac{{VC}}{{1 + {e^{{{ - \left( {P - c} \right)} \mathord{\left/
{\vphantom {{ - \left( {P - c} \right)} d}} \right.
\kern-\nulldelimiterspace} d}}}}}\]](form_161.png)
![\[{P_{cl}} = c - 2d\]](form_162.png)
![\[{P_{cu}} = c + 2d\]](form_163.png)
Where (V) is the individual lung volume, (P) is the intrapulmonary pressure, and the other variables are defined in Figure 6. These equations can be rearranged and input with known parameters to determine the instantaneous expected pressure (P) of each lung. First, the baseline side compliance (Csb) is determined knowing the baseline chest wall (Ccwb) and baseline lung (Clb) compliances,
![\[{C_{sb}} = \frac{1}{{\frac{1}{{{C_{cwb}}}} + \frac{1}{{{C_{lb}}}}}}\]](form_164.png)
The expected intrapulmonary pressure (P) at the a given volume (V) can be calculated knowing the individual lung functional residual capacity (FRC), residual volume (RV), and vital capacity (VC) by the following,
![\[\lambda = \ln \left( {\frac{{FRC - RV}}{{RV + VC - FRC}}} \right)\]](form_165.png)
![\[{P_{cu}} = \frac{{VC - FRC}}{{{C_{sb}}}}\]](form_166.png)
![\[c = - \frac{{{P_{cu}}\lambda \left( {2 - \lambda } \right)}}{2}\]](form_167.png)
![\[d = \frac{{{P_{cu}} - c}}{2}\]](form_168.png)
![\[P = d \cdot \ln \left( {\frac{{V - RV}}{{RV + VC - V}}} \right) + c\]](form_169.png)
Then, the instantaneous chest wall compliance (Ccw) to apply at the current timestep is found using the side compliance (Cs) by,
![\[{C_s} = \frac{{V - FRC}}{P}\]](form_170.png)
![\[{C_{cw}} = \frac{1}{{\frac{1}{{{C_s}}} - \frac{1}{{{C_{lb}}}}}}\]](form_171.png)
Standard Lung Volumes and Capacities
There are a number of standard lung volumes and capacities that are measured during different stages of normal and deep breathing cycles. The inspiratory reserve volume (IRV), tidal volume (VT), expiratory reserve volume (ERV), and residual volume (RV) correspond to the four standard lung volumes. The inspiratory capacity (IC), forced residual capacity (FRC), vital capacity (VC), and total lung capacity (TLC) are the four standard lung capacities that consist of two or more standard lung volumes. These volumes and capacities are good diagnostics for lung functionality, and the Respiratory Model reports their values as outputs. As mentioned above, some of the parameters are obtained from patient data as input variables. The TLC and FRC are two of these parameters that are drawn from the patient data. For the standard patient in the model, TLC and FRC are set to be 6.0 L and 2.4 L, respectively. Using these parameters as inputs, the engine calculates the other standard lung volumes and capacities as described below.
Residual volume (RV)
The residual volume is the volume of gas remaining in the lungs after maximal exhalation. As mentioned above, the Respiratory Model approximates the residual volume based on the patient weight (RV = 16.0 mL/kg) ([316] , [180] ). For the standard patient in the model with 77 kg weight, the residual volume RV=1.23 L. Typical values of RV vary in the literature. For example, for 70 kg patients: RV=1.5 L [207] , 1.2 L [323], and 1.682 L [336] . The engine employs weight-based relation and the values used in the engine are close to those found in the literature [323] .
Expiratory Reserve Volume (ERV)
ERV is the maximum volume below the tidal volume that can be expired during maximal forced expiration. ERV can be calculated as
![\[ERV=FRC-RV\]](form_172.png)
In this equation, both FRC and RV are input values obtained from weight-based relation. For the standard patient in the model (77 kg adult male), FRC=2.31 L, and RV=1.23 L, thus ERV becomes ERV=1.08 L. Typically, reported values for ERV are around 1.1 L [148] .
Tidal volume (VT)
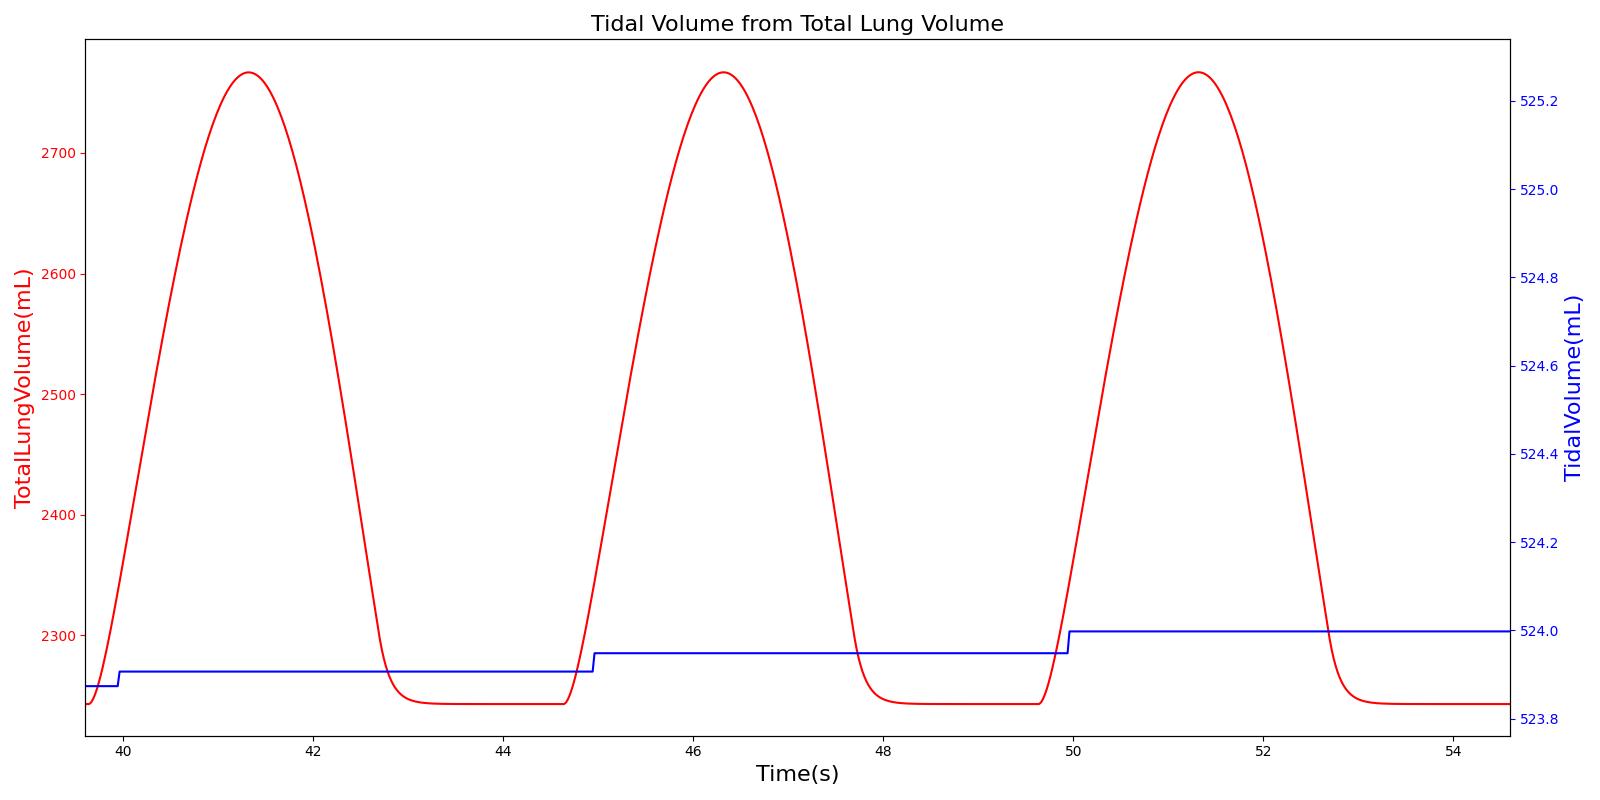
Tidal volume corresponds to the volume of air inspired or expired in a single breathing cycle during normal quiet breathing. For a healthy 70 kg adult, the tidal volume is 540 ml per breath. The tidal volume can be calculated by numerically integrating the volumetric flow rate of inspired air flowing through the trachea. The Respiratory Model calculates the tidal volume by taking the difference between the maximum and minimum total lung volumes during each breathing cycle.
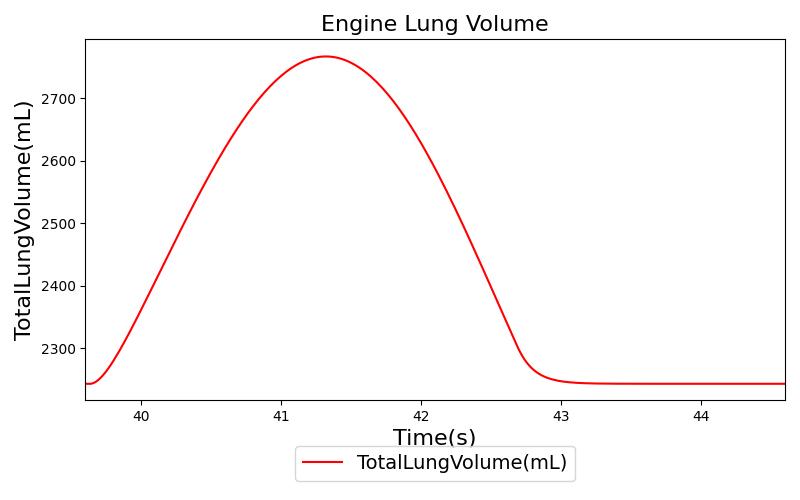
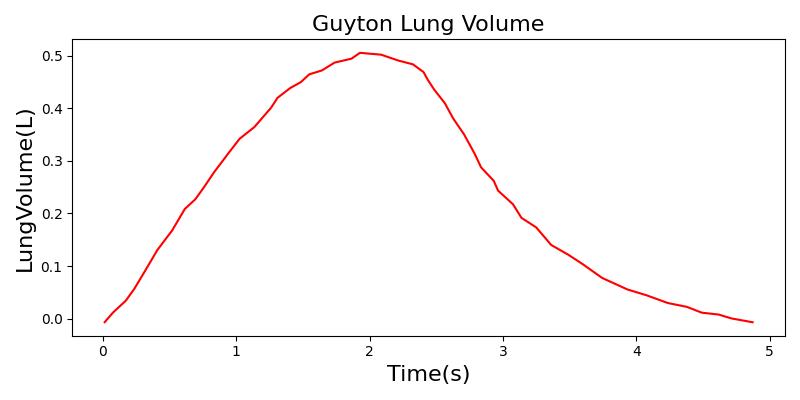
Figure 7 depicts the typical lung volume waveform for multiple breathing cycles. The Respiratory Model outputs the value of VT for each breathing cycle. Figure 7 presents the plot of the total lung volume and VT as a function of time.
Inspiratory Reserve Volume (IRV)
IRV is the additional volume, above the tidal volume, that can be inspired during maximal forced inspiration. IRV can be calculated from total lung capacity (TLC) using the relation
![\[IRV=TLC-FRC-V_{T} \]](form_173.png)
Both TLC and FRC are weight-based inputs to the model, whereas VT is calculated as described above. Using TLC=6.16 L (i.e., 80 mL/kg) and FRC=2.31 L (i.e., 30 mL/kg) of the standard patient in the model, IRV becomes 3.307 L for an average VT of 543 mL, where the average VT is calculated by taking the time average of VT described above. Using weight-based tidal volume of VT = 7 mL/kg [207] , IRV can be shown to be 3.31 L for 77 kg patient, in good agreement with the value from the model.
Vital Capacity (VC)
VC is the volume of air that can be expired after maximal inspiration. VC can be calculated as
![\[V_{C} =IRV+V_{T} +ERV\]](form_174.png)
VC can also be calculated using TLC as:
![\[V_{C} =TLC-RV\]](form_175.png)
Again, both TLC and RV are weight-based inputs to the model, and VT is calculated as described above. For the standard patient in the model with TLC=6.16 L (80 L/kg) and RV=1.23 L, VC=4.93 L. Typical values of VC reported in the literature are around 4.6 L [323] . The value in the engine corresponds to a weight-based vital capacity.
Inspiratory Capacity (IC)
The inspiratory capacity is another standard lung capacity that can be calculated from TLC and FRC as
![\[IC=TLC-FRC\]](form_176.png)
In the model, both TLC and FRC are weight-based input variables, and IC can be calculated using the above equation. From the values in the model, IC can be determined to be 3.85 L.
Ventilation
Respiration Rate (RR)
As described above, the Respiratory Model employs chemical feedback mechanisms to regulate the ventilation frequency that affects the breathing cycle through the respiratory driver. The breathing frequency is adjusted in accordance to the arterial O2 and CO2 levels and other modifiers, such as drug and metabolic effects. The engine switches between the inspiratory and expiratory phases based on the predicted ventilation frequency. The respiration rate is then calculated by measuring the time taken for a complete breathing cycle and converting it to the number of breaths per minute. Typically, the respiration rate of a healthy adult is 16 breaths/min [207] . A similar value is obtained for the standard patient under normal tidal breathing.
Total Pulmonary Ventilation
The total pulmonary ventilation (or minute ventilation or minute volume) is the volume of air moved into the lungs per minute. Minute ventilation (V.E) is the product of tidal volume (VT) and respiration rate (RR), i.e.,
![\[\dot{V}_{E} =V_{T} *RR\]](form_177.png)
The Respiratory Model calculates both VT and RR from the simulation data. V.E can thus be determined from the above equation by using the average values of VT and RR. For the standard patient in the model, under normal physiological conditions, the average values of VT and RR are 0.540 L and 16 breaths/min, respectively. The total pulmonary ventilation obtained from the model equals 6.53 L/min. Typical weight-based value of minute volume is 84 mL/min/kg [207] . Using the mass of the standard patient (77 kg), the expected value of V.E is 6.48 L/min, which is close to the value found from the engine.
Alveolar Ventilation
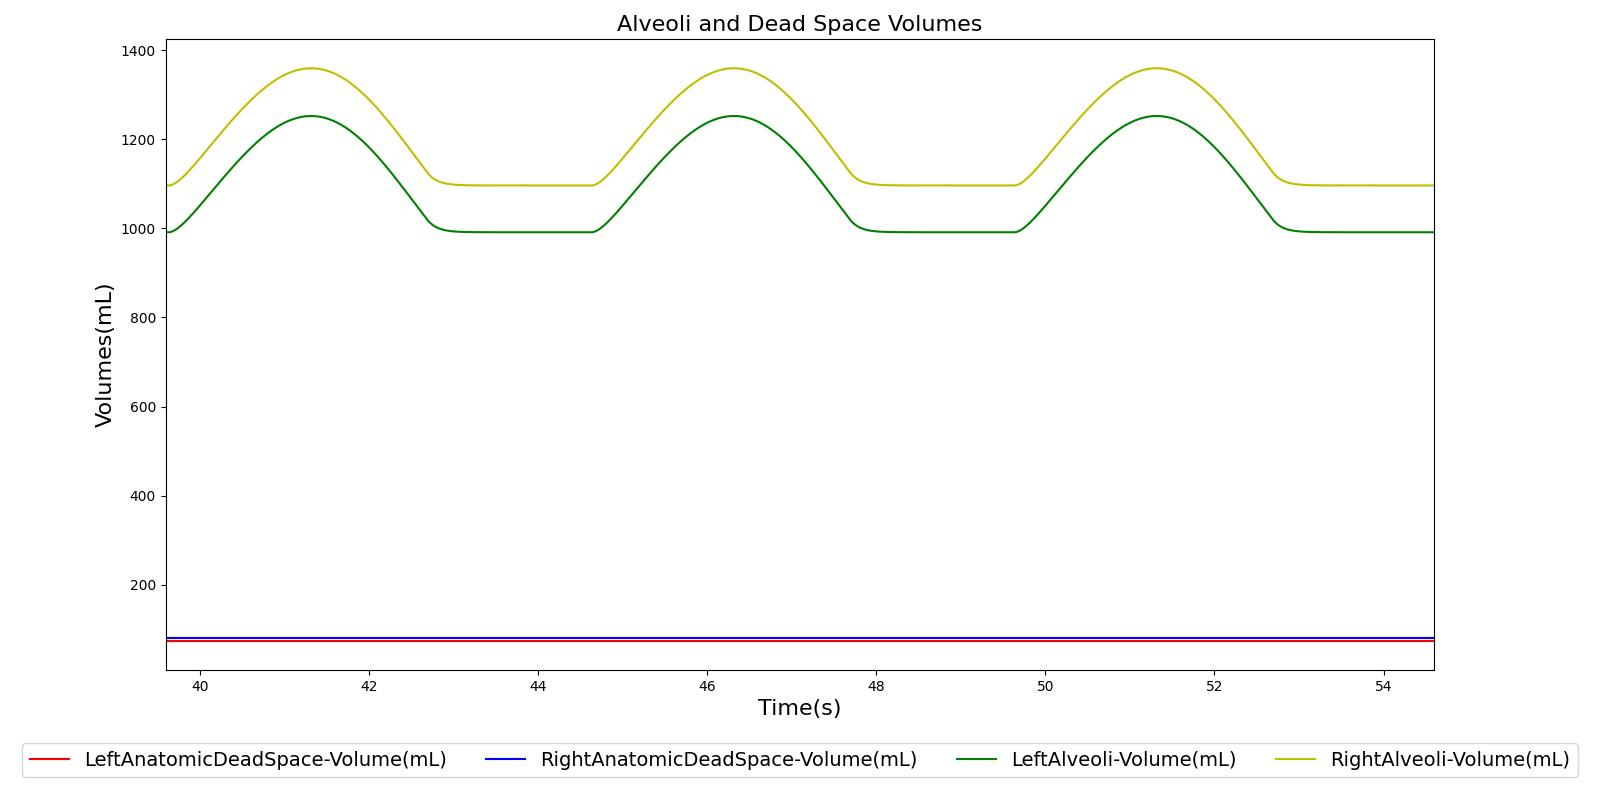
The term alveolar ventilation corresponds to the volume of air entering and leaving the alveoli per minute [207] . The alveolar ventilation is calculated as V.A=(VT-VD)*RR where V.A is the alveolar ventilation in liters per minute and VD is the volume of the conducting airways that is referred to as the anatomical dead space. This is the region of respiratory tract where no gas exchange takes place. In the Respiratory Model, the volume of the dead space is calculated from the values assigned to the right and left anatomic dead space nodes. These nodes have continuously changing volumes due the compliances that are connected to the nodes. The right and left anatomic dead space volumes when compared to the right and left alveoli volumes are shown in Figure 8. When the patient weight is factored into the calculation, the alveolar ventilation predicted from the model is close to the expected value.
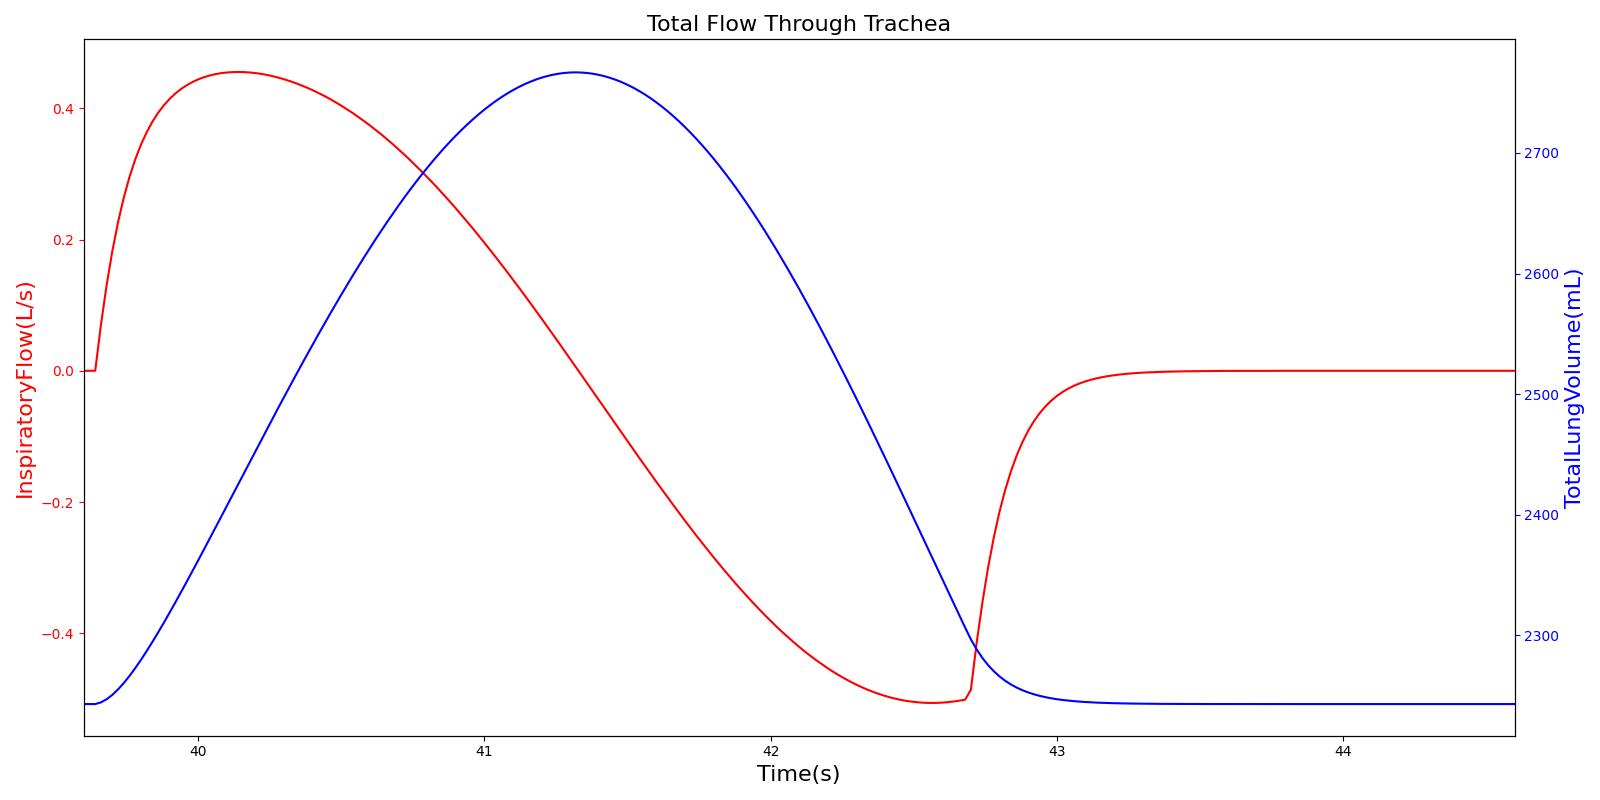
Tracheal Airflow
Airflow is measured by taking the instantaneous pressure difference across a fixed resistance. The Respiratory Model measures tracheal airflow Qtrachea by using the instantaneous pressure difference across the tracheal resistance Rtrachea as:
![\[Q_{trachea} =\frac{P_{mouth} -P_{carina} }{R_{trachea} } \]](form_178.png)
Pmouth and Pcarina are the pressures at the mouth and the carina nodes, respectively. The figure shown below presents the absolute flow rate (no distinction for flow direction) for one breathing cycle.
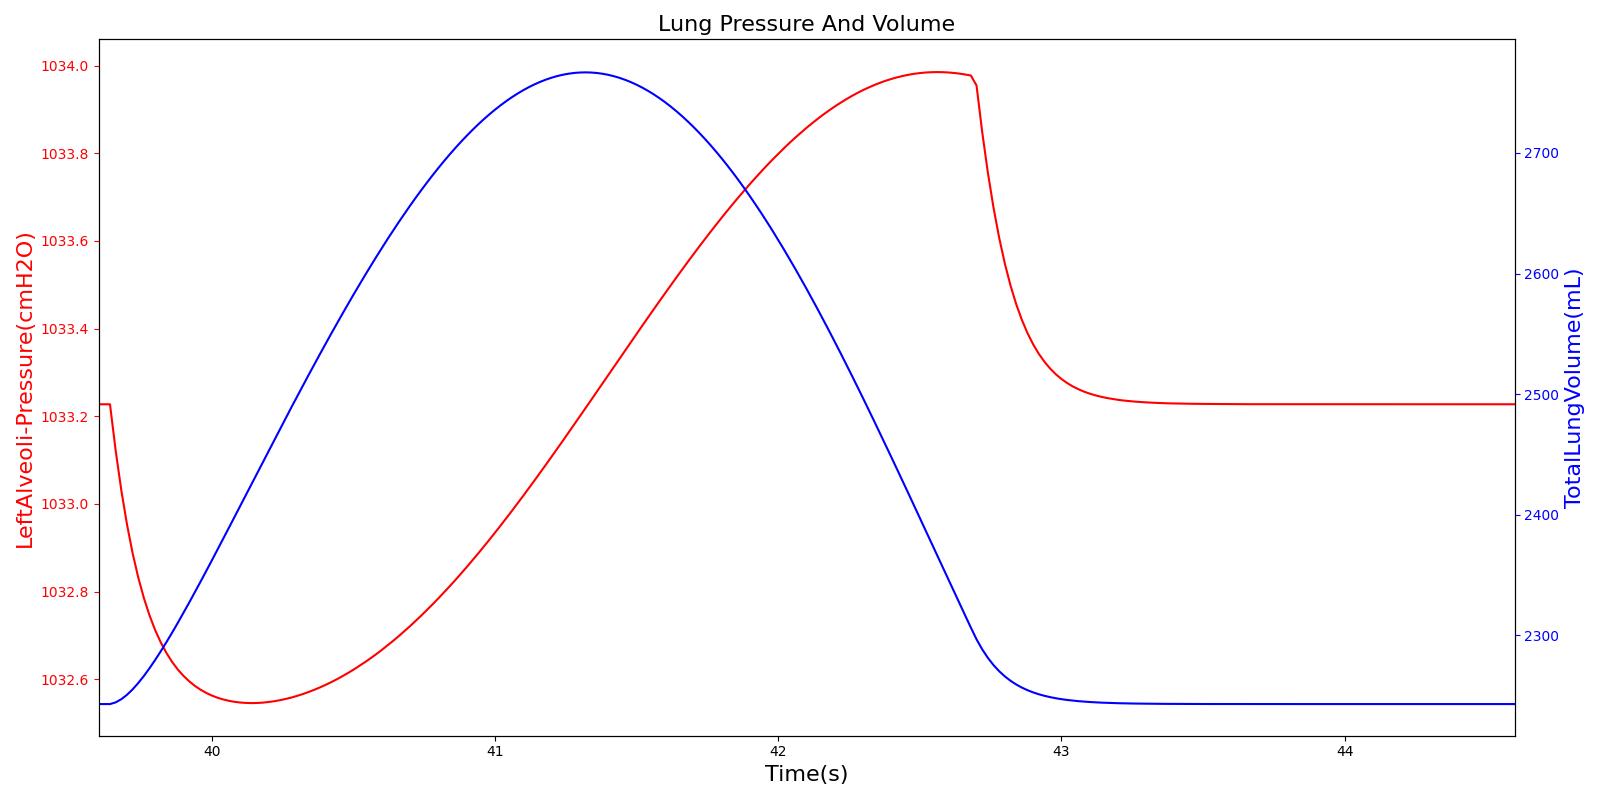
Alveolar Pressure
The instantaneous pressures at the nodes of the respiratory circuit are calculated by solving the circuit matrix equation as described in the Circuit Methodology. The pressures at the right and left alveoli nodes of the Respiratory Model represent the alveolar pressure. Typically, the values of the alveolar pressure vary in the range from -1.8 cm H2O to 1.8 cm H2O (relative to atmospheric pressure) during the inspiration and expiration phases of the breathing cycle [258] . The figure below depicts the alveolar pressure along with lung volume for one breathing cycle. The alveolar pressure in the engine is absolute (not relative to atmospheric pressure), so the relative pressure can be determined by subtracting the standard atmospheric pressure of 1033 cmH2O - giving outputs close to the range of -1.8 cm H2O to 1.8 cm H2O found in the literature [258] .
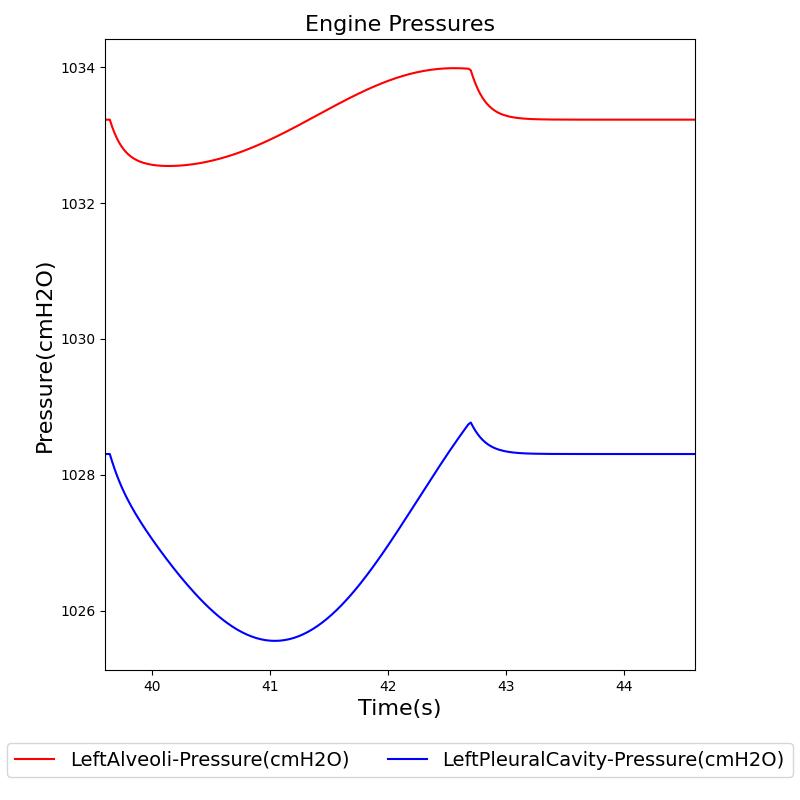
Transpulmonary pressure
Transpulmonary pressure is defined as the difference between the alveolar and the intrapleural pressures. The Respiratory System derives the transpulmonary pressure from the calculated values of the alveolar pressure and intrapleural pressures. The alveolar pressure is obtained by taking the average of the left and right alveolar pressures. Similarly, the total intrapleural pressure is obtained by taking the average of the the left and right pleural pressures. The plots shown below compare the transpulmonary pressure from the engine with that found in literature [148]. Some variations in the waveforms and possibly the average values is a consequence of the specific driver pressure and patient parameters employed in the engine.
 |
 |
 |
 |
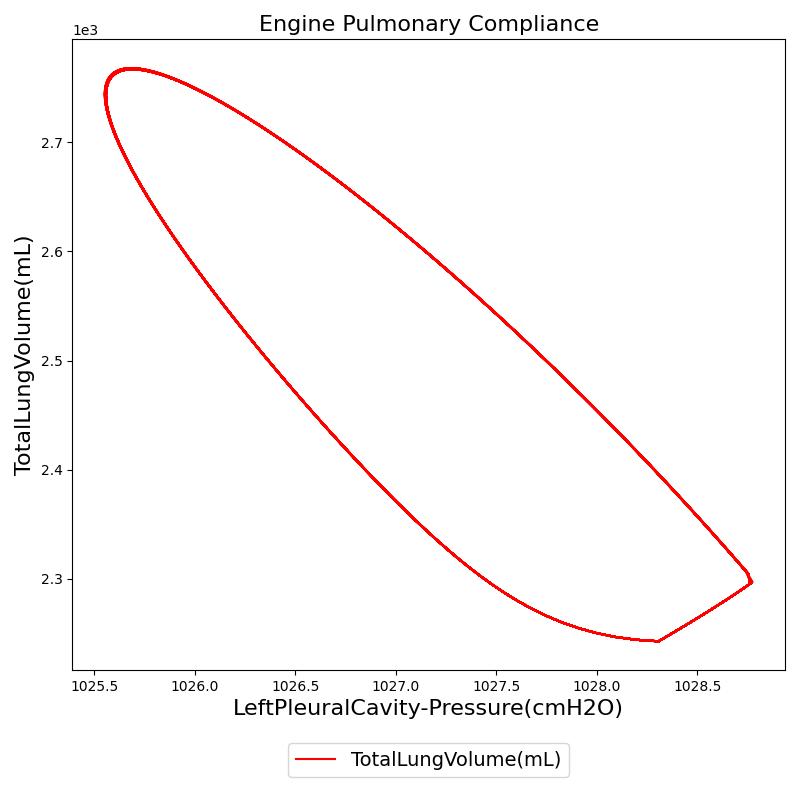
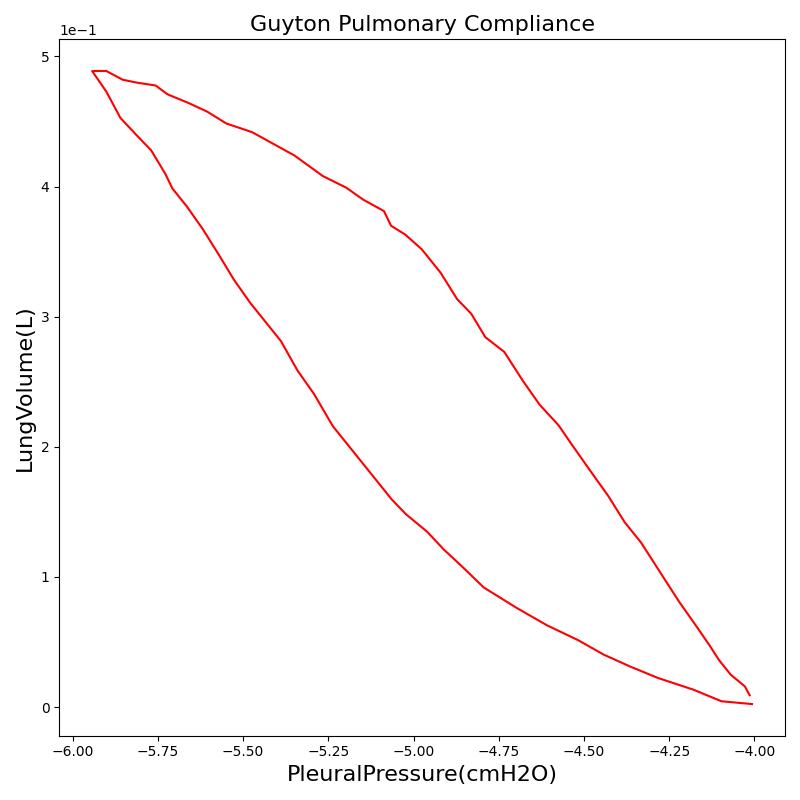
Pressure-Volume (P-V) curve
One method of characterizing the lungs' elastic behavior is to use a diagram that relates the lung volume changes to changes in pleural pressure. The pressure-volume curve of a healthy person shows hysteresis during the inspiratory and expiratory phases. Figure 12 presents the pressure-volume diagram of data extracted from the Respiratory Model. For comparison, the plot also shows a P-V diagram reproduced from literature [148] . The figures show the plot of lung volume changes versus pleural pressure for one breathing cycle. The pleural pressure from the model is the average of the right and left pleural pressures. The lung volume change corresponds to the change in the total lung volume
during a complete breathing cycle.
As shown in the figure, the Respiratory Model mimics the expected hysteresis of the P-V curve.
 |
 |
Partial Pressures of Respiratory Gases
For any gas mixture, the partial pressure Pgas of a particular gas in the mixture can be calculated based on the total pressure Ptotal of all gases in the mixture and the fractional concentration Fgas of the gas as
![\[P_{gas} =F_{gas} *P_{total} \]](form_179.png)
The Respiratory Model calculates the partial pressure of a gas at any node based on the total pressure and the volume fraction of the gas at the node. The node volume fraction of the gas and the node pressure are calculated in a manner described in the Substance Transport Methodology and Circuit Methodology, respectively. The Respiratory Model employs the above equation to predict the partial pressure of gases in the Respiratory System. The sections below present the results of alveolar and tracheal partial pressures of O2 and CO2.
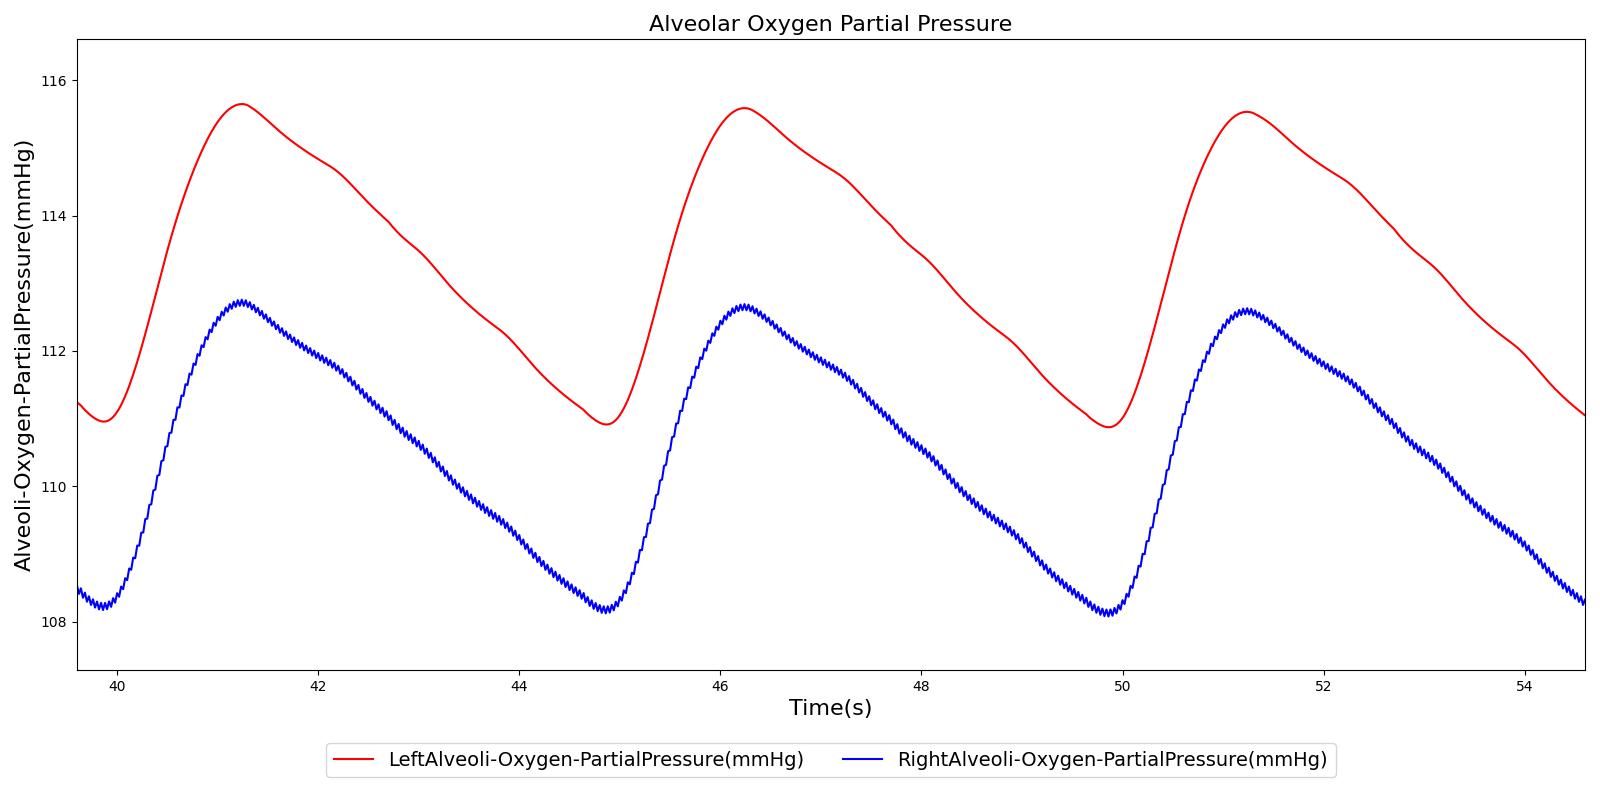
Alveolar O2 Partial Pressure
The engine calculates the O2 partial pressure PLungO2 at each alveoli node by using the oxygen volume fraction VFLungO2 and the total pressure PLung at the alveoli nodes as
![\[P_{LungO_{2} } =VF_{LungO_{2} } *P_{Lung} \]](form_180.png)
The alveolar O2 partial pressure can thus be determined by taking the average of O2 partial pressures at the two alveoli nodes. In the model, the alveoli node pressures are gauge pressures and are expressed relative to the atmospheric pressure. The model converts these relative pressures to their absolute pressures when calculating the gas partial pressures. The engine assumes the inspired air is heated and humidified. Therefore, the water vapor pressure at normal body temperature (PH2O=47 mm Hg) is subtracted from the standard atmospheric pressure of PB=760 mm Hg when the gas partial pressure is calculated using the absolute lung pressure, i.e.,
![\[P_{LungO_{2} } =VF_{LungO_{2} } *(P_{B} -P_{H_{2} O} +P_{Lung} )\]](form_181.png)
Figure 13 depicts the plot of PLungO2 for the left and right alveoli of the standard patient. Typically, the average alveolar partial pressure of oxygen is 104 mmHg [207] . The value from the engine is close to that of the literature.
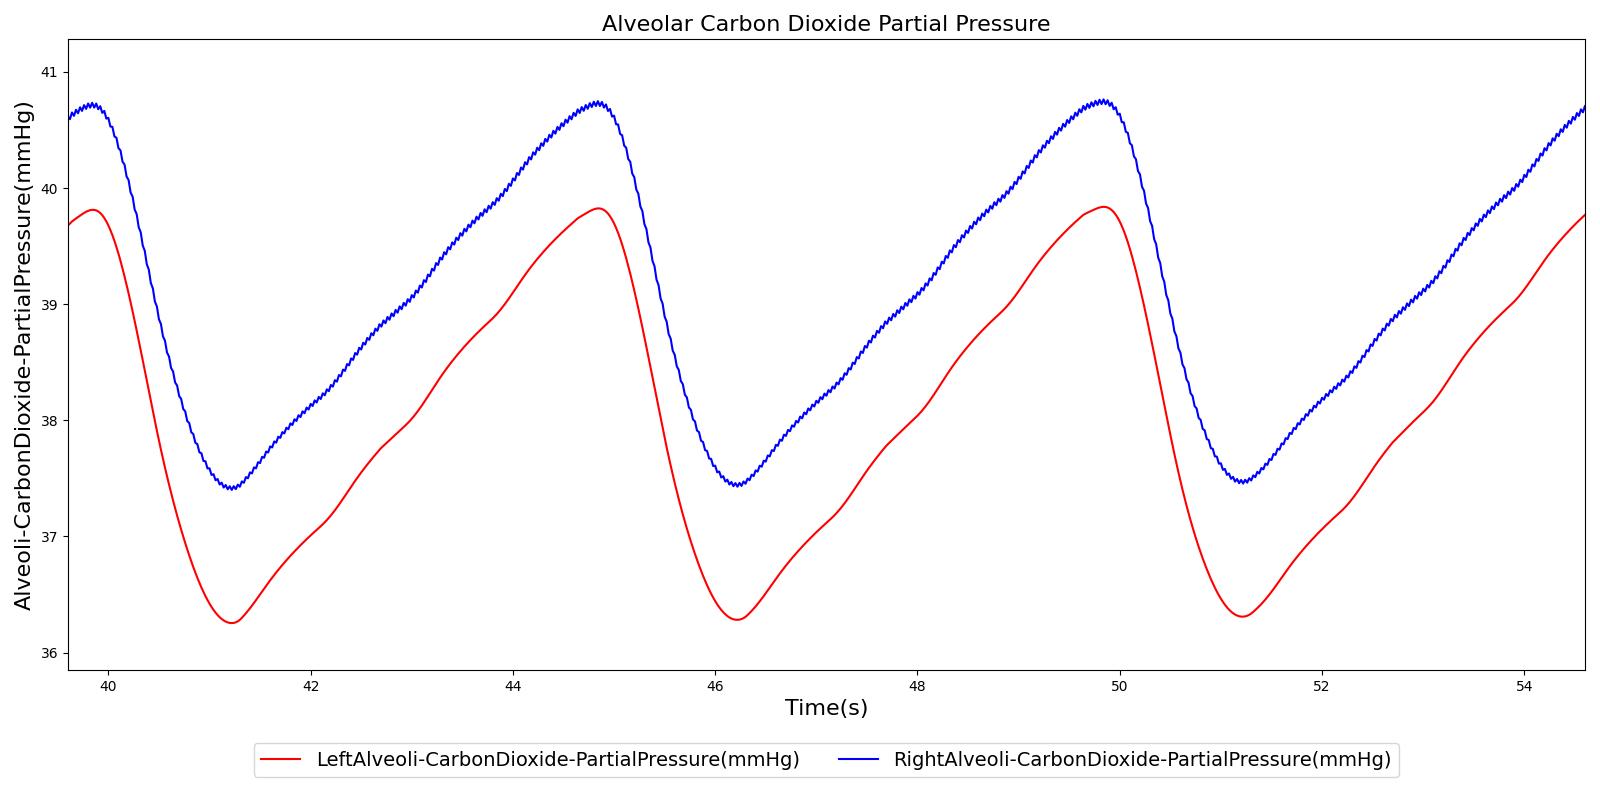
Alveolar CO2 Partial Pressure
The alveolar CO2 partial pressure is calculated in the same manner as the oxygen partial pressure. Figure 14 depicts the plot of alveolar CO2 partial pressure for the left and right alveoli nodes. Typically, the average alveolar CO2 partial pressure is 40 mmHg [207] . The prediction from the engine is close to the expected literature value.
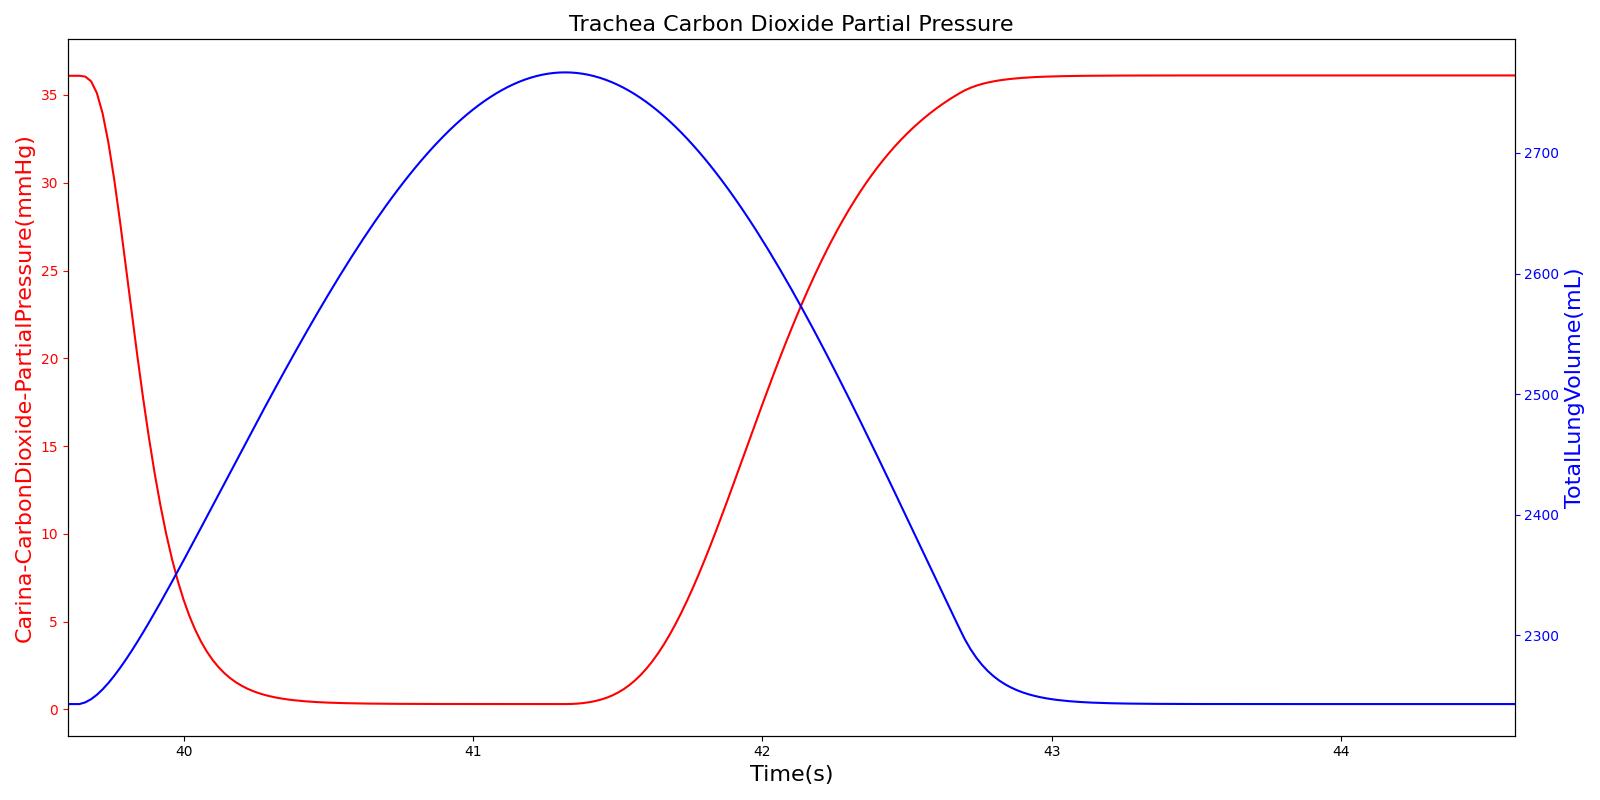
Tracheal CO2 Partial Pressure
Tracheal CO2 partial pressure is calculated in the same manner as the alveolar CO2 partial pressure. The engine calculates the tracheal partial pressure by using the pressure at the carina node. Recall that the carina node belongs to the node where the trachea branches into the mainstem bronchi. The figure below depicts the time variation of tracheal CO2 partial pressure. The waveform for CO2 partial pressure appears similar to those found in normal capnograph at the mouth (Fig.3.9, Ref [207] ).
Tracheal O2 Partial Pressure
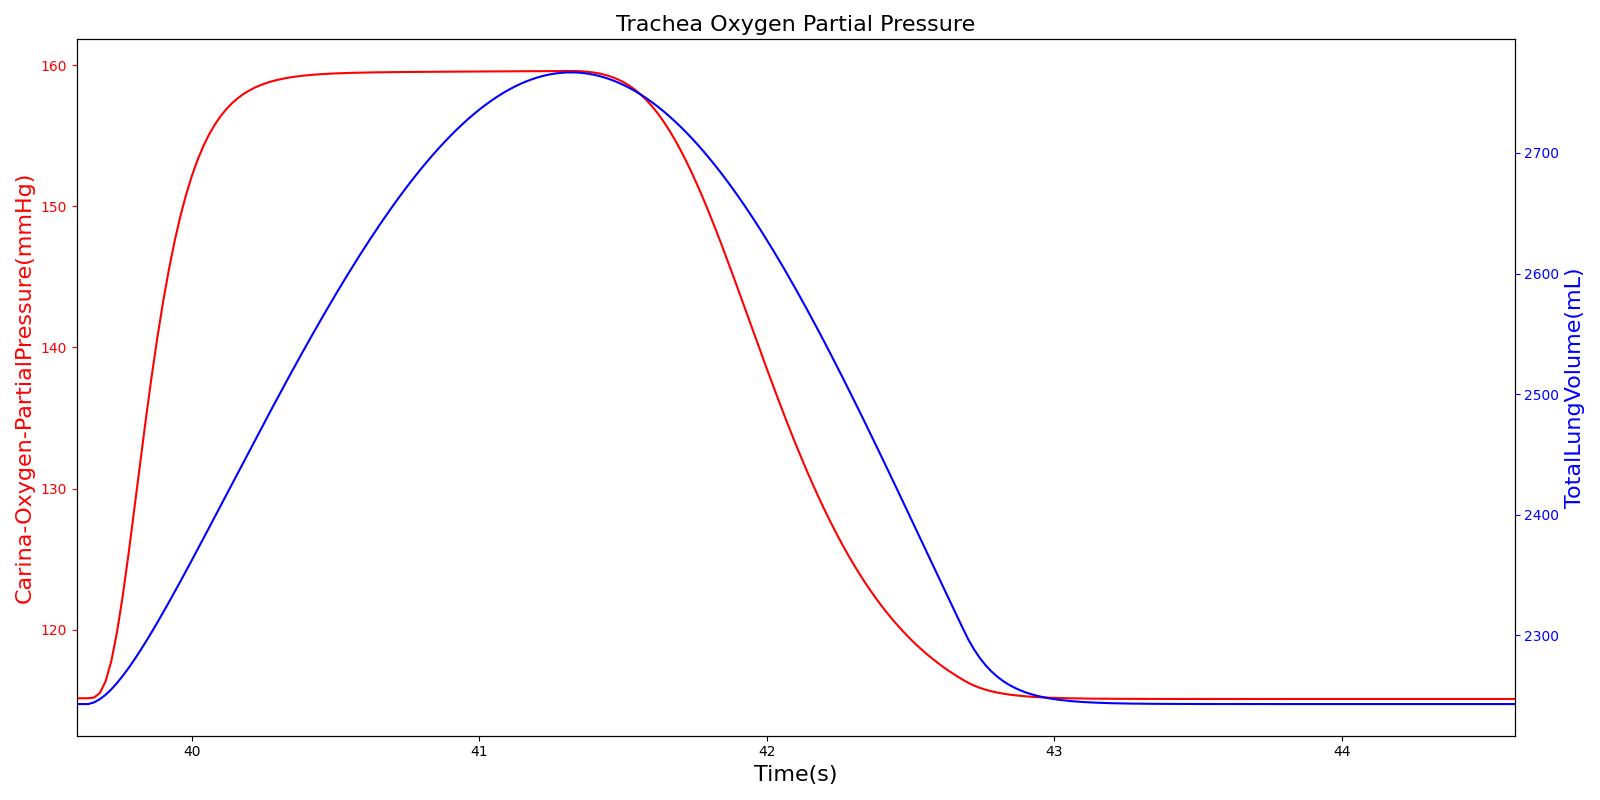
The O2 partial pressure at the trachea is calculated in the same manner as the alveolar O2 partial pressure. As mentioned for CO2 partial pressure, the model calculates the tracheal O2 partial pressure by making use of the pressure at the carina node. The output of the tracheal O2 partial pressure calculation is presented in Figure 16.
Dependencies
The Respiratory System interacts with other physiological systems either directly or indirectly through processes that involve the transport and exchange of gases. These interdependencies are discussed below.
Gas Transport
The transport of gases in the Respiratory Model is handled through the Transport functionality of the engine, where mass conservation based on volume fraction and volumetric flow rate of gases at the nodes and paths of the respiratory circuit is employed (see the Substance Transport Methodology for details). During free breathing, the ambient atmospheric volume fractions are used as an input to the Respiratory Model.
By using methods described in the Substance Transport Methodology, the engine calculates the volume fraction of gases at the nodes associated with the respiratory functional units. The Respiratory System uses the calculated volume fractions and predicts various physiological parameters. For example, the gas volume fraction at the end of expiration, referred to as end-tidal gas concentration, can be monitored based on the results from the Substance Transport Methodology calculation. The end-tidal gas concentration is an important clinical parameter for monitoring patients and preventing mishaps related to insufficient ventilation or inappropriate gas concentration during anesthesia and immediate recovery [210]. Monitoring end tidal CO2 (ETCO2) is a widely established clinical practice for verification of endotracheal tube placement and is also one of the standard requirements for monitoring patients in transport [86]. The Respiratory Model provides the end-tidal gas concentration based on the expired gas volume fractions at the airway node.
Environment
The Respiratory System interacts with the Environment System for the atmospheric pressure values assigned to the mouth node. Changes to the environmental conditions, such as changes in altitude, ambient temperature, humidity, and others, can affect the breathing pattern of the patient. The Respiratory System interacts with the Environment System to utilize the values of ambient pressures and gas concentrations that reflect the environmental condition. The Respiratory System also interacts with the Environment System for proper handling of inhaled gases that can arise from environmental incidents.
Alveolar Gas Exchange
At the alveoli-capillary interface, gas transfer occurs. The primary goal is to transfer incoming oxygen into the bloodstream for transport to other organs and to transfer waste carbon dioxide out of the body. This mechanism is also used to transport inhaled agents into the bloodstream from the Respiratory System. For more details on gas transport, see Substance Transport Methodology and Blood Chemistry Methodology.
In the Respiratory Model, the spontaneous respiration rate is adjusted based on a chemical feedback mechanism that depends on the arterial oxygen and carbon dioxide levels as described above. The arterial oxygen and carbon dioxide levels depend on the level of O2 consumption and CO2 production in the circulatory system, which in turn affects the gas exchange at the alveolar-capillary interface. As the arterial O2 and CO2 levels change, the breathing rate, tidal volume, and alveolar ventilation also change, which in turn facilitates efficient gas exchange between the atmosphere and the body. This presents an example of how the engine integrates the circulatory and Respiratory Systems to regulate the blood gas levels.
Drug Effects
As drugs circulate through the system, they affect the Respiratory System. The drug effects on respiratory rate and tidal volume are calculated in the Drugs System. These effects are applied to the respiratory driver by modifying the frequency and amplitude of the breathing cycle. During the respiratory driver calculations, the respiratory rate and tidal volume changes that are calculated in the Drugs System are applied to the resulting respiratory rate and tidal volume calculated in the driver. Additionally, a neuromuscular block level is applied based on the drug effects. If the neuromuscular block level is above 0.15 on a scale of 0 to 1.0, then the respiratory rate and tidal volume are set to zero. This represents the paralytic effects of a neuromuscular block agent. The value of 0.15 was chosen to satisfy the block duration for succinylcholine and rocuronium. The strength of these effects, including the block effect, are calculated based on the plasma concentration and the drug parameters in the substance files in the Drugs System. For more information on this calculation see Drugs Methodology.
Metabolic Effects
A metabolic modifier is set by the Energy System (Energy Methodology) to drive the system to reasonable levels achievable during increased metabolic exertion. The modifier is tuned to achieve the correct respiratory response for near maximal exercise, and a linear relationship is assumed. This modifier is a direct multiplier to the target alveolar ventilation input into the system driver, and it causes an increase in both tidal volume and respiration rate.
Anesthesia Machine Connection
The Respiratory System can be hooked up to the anesthesia machine for positive-pressure ventilation (see the Anesthesia Machine Methodology). This is achieved by connecting the two fluid circuits. The anesthesia connection node is merely connected to the respiratory mouth node to allow for automatic calculation of the fluid mechanics by the circuit solver and transport by the substance transporter. The mechanistic cascading effects are automatically acheived, and everything else is modeled exactly the same as when the systems are disconnected.
Outputs
At each time iteration, the Circuit Solver calculates the values of the state variables for that particular time. Using the calculated state variables, the model predicts various physiological parameters of mechanical ventilation. Many of the calculated system data outputs are derived from the difference between the minimum and maximum lung volumes and the time between occurances - e.g., tidal volume and respiration rate.
Other values, like the pulmonary resistance and compliance, are determined instantaneously. The pulmonary resistance is calculated by taking the ratio of the pressure difference between the mouth Pmouth and the alveoli Palveoli and the flow across the trachea Qtrachea as
![\[R_{pulm} =\frac{P_{mouth} -P_{alveoli} }{Q_{trachea} } \]](form_182.png)
The Respiratory Model calculates the pulmonary compliance Cpulm by dividing the tidal volume VT by the intrapleural pressure Ppleu difference as
![\[C_{pulm} =\frac{V_{T} }{P_{pleau(max )} -P_{pleu(min )} } \]](form_183.png)
Here Ppleu(min) and Ppleu(max) are the minimum and maximum respective pressures at the right and left pleural nodes.
Assumptions and Limitations
Assumptions
As in most lumped parameter models of mechanical ventilation, the Respiratory Model is based on two main parameters: the resistance R and the compliance C (or elastance E). Similar to their electrical analogues, these elements form a closed circuit to represent the energy dissipation and storage properties of the normal tidal ventilation. One extension of the linear model is the addition of inertance in the lumped parameter model. Inertance is not included in the model on the assumption that inertia does not play a significant role under conventional tidal breathing, as opposed to high-frequency ventilation.
In the model, the Respiratory System is assumed to behave linearly in that the hydraulic resistance R is assumed to be independent of the flow rate Q, and the elastance E or the compliance C of the elastic component is assumed to be independent of the volume V. Therefore, under normal physiological conditions, the circuit elements (resistors and capacitors) of the Respiratory System are treated as constants. However, their values can be adjusted when addressing pathological conditions.
The Respiratory Model does not distinguish between different functional units in the upper airway, the anatomical region where the inspired air is heated, humidified, and filtered. In this region, the flow of air is turbulent, as opposed to the laminar flow in lower airways. That means that the Ohm's analogue pressure-volume relation cannot be applied to this region. However, the model treats the upper airway as part of the mouth node and assumes laminar, incompressible flow for the remaining airway.
Limitations
The current version of the Respiratory Model does not account for the upper airways, and the detailed nature of upper airway flows will not be captured in the model. It is known that flows at the upper airways are turbulent, while flows in the lower respiratory tract are laminar. The absence of upper airways in the model can underestimate the airway flow. In this regard, the lumped parameter model is inherently at a disadvantage in handling complex geometries and flows that can represent detailed upper airway pathology. However, the model is sufficiently detailed to reproduce the respiratory responses associated with a number of airway pathologies at relatively low computational cost.
Airway inertance is assumed to be negligible at normal respiratory frequencies. However, analysis of high-frequency ventilation (HFV) of up to 40 Hz ventilatory frequency would require the inclusion of inertance [307] . In mechanical ventilation, HFV is a useful procedure that permits significantly decreased pressure amplitude and tidal volume, preventing trauma in artificial ventilation. When compared to conventional mechanical ventilation, HFV is considered to be the preferred method of mechanical ventilation in patients with acute lung injury [199] . The small tidal volumes needed in HFV are thought to offer an advantage over conventional ventilation in limiting additional lung injury from mechanical ventilation [199] . The current version of the Respiratory Model handles conventional mechanical ventilation but not HFV.
The model makes no distinction between different generations of bifurcating airways. Therefore, factors affecting the regional ventilation and perfusion of the lungs cannot be captured by the model.
Insults and Interventions
General Approach
Disease states are applied to the simulated patient by modifying various parameters. Chronic conditions stabilize to a new homeostatic point before the simulation begins. Pulse simulates both restrictive and obstructive diseases of varying severities with different continuous function mappings. Table 2 shows parameter settings for representative conditions and severities based on trends and values determined from literature [48] [18] [155] [8] [19] [34] [47] [170]. Most respiratory-specific pathophysiology is applied as parameter multipliers (y) determined by a severity (x) setting between 0 and 1, with the following exponential or linear functions:
![\[y = {10^{\log \left( {x\frac{b}{a}} \right) + \log \left( a \right)}}\]](form_184.png)
![\[y = \left( {b - a} \right)x + a\]](form_185.png)
Growth/increasing functions define a as 1 and b as the maximum multiplier, while decay/decreasing functions define b as 1 and a as the minimum multiplier. Therefore, a severity of 0 will not change the healthy value and allows for an intuitive continuous function without any discontinuities. The respiratory system also includes logic to combine effects for each parameter when multiple insults/interventions are applied.
When positive pressure ventilation is applied (i.e., mechanical ventilator or anesthesia machine), there is a change in the respiratory circuit's resistance and compliance [18]. Intubated patients will have these modifiers stacked/combined with all other action/condition modifiers.
Table 2. Property changes due to the application of respiratory diseases and positive pressure ventilation. ARDS and COPD are applied by the user with a severity defined between 0 and 1 and mapped using with linear or exponential functions. Mild severity = 0.3, moderate severity = 0.6, severe severity = 0.9. The fatigue factor is a multiplier on the muscle pressure source target that effectively reduces the tidal volume due to the increased effort of breathing.
| Parameter | System | Standard Healthy | Positive Pressure Ventilation | Restrictive (ARDS) | Obstructive (COPD) | ||||||
|---|---|---|---|---|---|---|---|---|---|---|---|
| Severity Mapping | Mild | Moderate | Severe | Severity Mapping | Mild | Moderate | Severe | ||||
| Alveolar Dead Space (L) | Respiratory | 0 | 0 | Polynomial Growth | 0 | 0.03 | 0.15 | Linear Growth | 0.3 | 0.6 | 0.9 |
| Airway Resistance (cmH20-s/L) | Respiratory | 1.125 | 12.375 | N/A | 1.125 | 1.125 | 1.125 | N/A | 1.125 | 1.125 | 1.125 |
| Bronchi Resistance (cmH20-s/L) | Respiratory | 0.45 | 0.45 | N/A | 0.45 | 0.45 | 0.45 | Linear Growth | 8.5 | 1.7 | 2.4 |
| Lung Compliance (L/cmH2O) | Respiratory | 0.1 | 0.04 | Exponential Decay | 0.07 | 0.05 | 0.04 | Exponential Growth | 0.1 | 0.11 | 0.14 |
| Inspiratory-Expiratory Ratio | Respiratory | 0.5 | 0.5 | Linear Growth | 0.7 | 1.1 | 1.5 | Linear Decay | 0.35 | 0.22 | 0.12 |
| Diffusion Surface Area (m^2) | Respiratory | 68 | 68 | Exponential Decay | 34 | 17 | 9 | Exponential Decay | 39 | 22 | 12 |
| Pulmonary Capillary Resistance (mmHg-s/mL) | Cardiovascular | 0.062 | 0.062 | N/A | 0.062 | 0.062 | 0.062 | Linear Growth | 0.16 | 0.25 | 0.35 |
| Pulmonary Shunt Resistance (mmHg-s/mL) | Cardiovascular | 8.9 | 8.9 | Exponential Decay | 2.75 | 0.81 | 0.25 | N/A | 8.9 | 8.9 | 8.9 |
| Fatigue Factor | Respiratory | 1 | 1 | Linear Decay | 0.76 | 0.52 | 0.28 | Linear Decay | 0.87 | 0.76 | 0.64 |
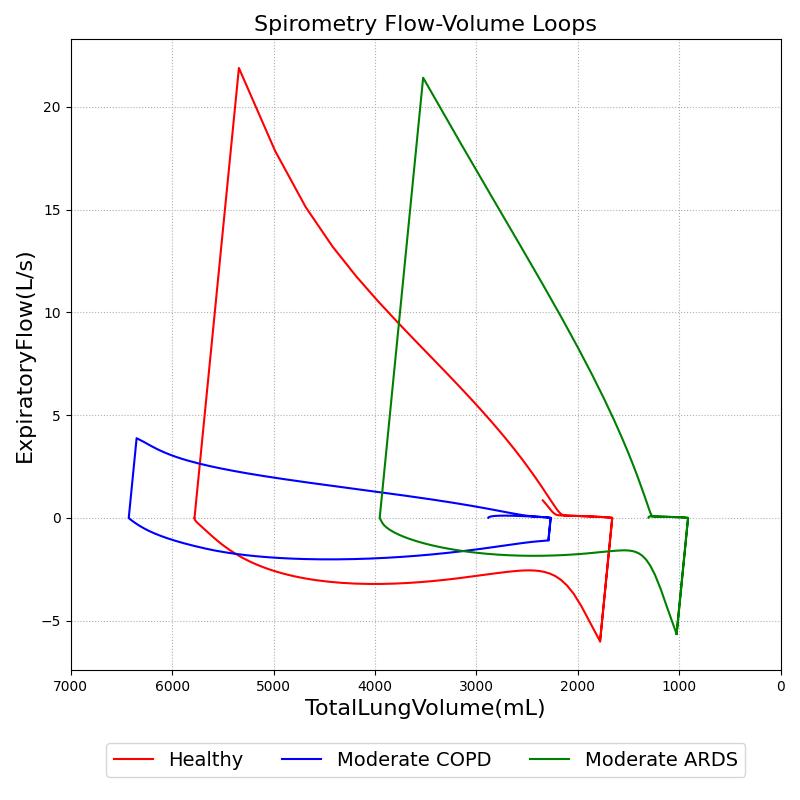
Modifications to respiratory circuit resistances and compliances can further be examined and validated through volume-flow curves, like those created during spirometry testing. Figure 17 shows results from a simulated pulmonary function test with the standard patient healthy and with moderate ARDS and COPD. The conscious respiration action was used to exhale to the expiratory reserve volume and inhale to the inspiratory capacity.
Conditions
Chronic Obstructive Pulmonary Disease
Chronic Obstructive Pulmonary Disease (COPD) is an obstructive lung disease characterized by chronically reduced airflow into the lungs. Symptoms typically include increased respiration rate, decreased tidal volume, decreased expiratory flow, and reduced oxygen saturation [219] . Unlike asthma, the reduction in airflow does not generally improve with medication. Symptoms typically worsen over time, often leading to death. COPD is caused by damage to the small airways in the lungs and destruction of the alveolar membranes. When tissue damage occurs primarily in the airways, the condition is called chronic bronchitis. When tissue destruction is focused in the alveoli, the condition is called emphysema. In the engine, COPD is a manifestation of both conditions, although one condition may dominate.
The engine simulates COPD by modeling damage to the small airways and alveolar membranes. COPD severity is controlled by two severity values, a chronic bronchitis severity value and an emphysema severity value. Chronic bronchitis severity is used to scale the airflow resistance through the lower airways in the circuit model, simulating airway tissue damage and scarring. Increasing chronic bronchitis severity increases the airflow resistance through the lower airways. The function used to determine airflow resistance for COPD is the same as that used for asthma and is based on chronic bronchitis severity.
Emphysema severity is used to scale destruction of the alveolar membranes. Destruction of the alveolar membranes decreases the effective surface area for gas exchange, thereby reducing alveolar gas transfer. In cases of severe emphysema, up to 80% of the alveolar membranes are destroyed, with a corresponding reduction in effective gas diffusion surface area [148]. The engine scales the gas diffusion surface area using a multiplier based on emphysema severity.
Additionally, The engine models destruction of lung tissue with an increase in alveolar compliance.
The destruction of the alveolar membranes also destroys the pulmonary capillaries embedded in the membranes. To model pulmonary capillary destruction, the engine increases the pulmonary capillary flow resistance based on severity. Although increased pulmonary capillary resistance is related to alveolar membrane destruction, and therefore associated with emphysema, the engine uses either emphysema severity or chronic bronchitis severity (whichever is higher) to determine the pulmonary capillary resistance multiplier. This was done in an attempt to model increased blood pressure and elevated heart rate, which are symptoms of both emphysema and chronic bronchitis. Increasing the capillary resistance should increase arterial blood pressure as the heart pumps harder to overcome the increased resistance in the lungs.
Decreased Inspiration-Expiration (IE) ratio is another pathophysiologic feature of COPD. As with asthma, the normal IE ratio is scaled using a multiplier based on severity. Either chronic bronchitis severity or emphysema severity (whichever is higher) is used to determine the IE ratio scaling multiplier.
Acute Respiratory Distress Syndrome
Acute Respiratory Distress Syndrome (ARDS) is modeled in the engine as a generic impairment of the alveoli's ability to exchange oxygen and carbon dioxide. The specific cause (i.e., sepsis, pneumonia, etc.) is not specified. The model is implemented to meet the PaO2/FiO2 Berlin Criteria combined with accepted pulmonary shunt fractions when mechanically ventilated. A severity value is mapped to various model parameters to achieve mild, moderate, and severe symptoms at severities of 0.3, 0.6, and 0.9 respectively. Direct modifiers are implemented as shown in Table 2.
Lobar Pneumonia
Lobar pneumonia is a form of pneumonia that affects one or more lobes of the lungs. Symptoms typically include increased respiration rate, decreased tidal volume, reduced oxygen saturation, decreased IE ratio, and increased body temperature [93] . As fluid fills portions of the lung, it becomes more difficult to breathe. Fluid also reduces the effective gas diffusion surface area in the alveoli, reducing alveolar transfer of oxygen and carbon dioxide into and out of the bloodstream [148] . The engine simulates lobar pneumonia by decreasing the alveoli compliance in the respiratory circuit, which models increased breathing difficulty due to fluid congestion in the alveoli. Similarly, gas diffusion surface area is reduced using the same function as for COPD. Decreased IE ratio is pathophysiologic feature of lobar pneumonia. Like COPD, the normal IE ratio is scaled using a multiplier based on severity.
Pulmonary Fibrosis
Pulmonary Fibrosis is a restrictive lung disease characterized by alveoli wall thickening. Symptoms typically include increased respiration rate, decreased tidal volume, decreased respiratory flow, reduced oxygen saturation, decreased IE ratio, and increased body temperature. As a result, the compliance of the lung is reduced making it stiffer and more difficult to expand during inspiration [191]. The engine models increased work of breathing due to alveoli wall stiffness in pulmonary fibrosis by decreasing alveoli compliance in the respiratory circuit. To model pulmonary capillary destruction, the engine increases the pulmonary capillary flow resistance based on severity. Increasing the capillary resistance should increase arterial blood pressure as the heart pumps harder to overcome the increased resistance in the lungs. The gas diffusion area is reduced using the same function as COPD. Decreased IE ratio is pathophysiologic feature of pulmonary fibrosis. Like COPD, the normal IE ratio is scaled using a multiplier based on severity.
Impaired Alveolar Exchange
The impaired alveolar exchange generically models an unspecified reduction of effective alveolar surface area. This condition causes less effective gas exchange between the Respiratory and Cardiovascular systems. The user can specify either a fraction or area value of the surface area to remove.
Actions
Airway Obstruction
Airway obstruction refers to a blockage in the airway that partially or wholly prevents airflow into or out of the lungs. Airway obstructions can occure at the lower and upper airways. They can be caused by foreign objects, allergic reactions, infections, inflammations, toxic gases, and other reasons. The pathological symptoms and physiological manifestations of airway obstructions are as diverse as the causes, and the severities of the obstructions follow suit. Dyspnea (breathing difficulty) is the obvious common symptom of airway obstruction. The complications of breathing difficulty include hypoxia (low oxygen levels) and hypercapnia (high carbon dioxide levels), respiratory acidosis, and others.
The current version of the Respiratory Model attempts to reproduce the physiological responses arising from foreign body upper airway obstruction. Foreign body airway obstruction is fairly common during anesthesia. One example is the case reported by [305] where the oxygen saturation (SPO2) of a patient dropped to 40 percent due to a blockage by a parasitic nematode during the use of a laryngeal mask airway. The Respiratory Model simulates airway obstruction by increasing the flow resistance across the path connecting the airway node to the carina node by mapping a user defined severity with an exponential growth function. This path corresponds to the flow through the trachea. The model then calculates the physiological responses due to increased airway resistance.
Bronchoconstriction
A patient with bronchospasm experiences a sudden constriction of the muscles in the walls of the bronchioles, decreasing the airway diameter. Such decrease in the bronchial airway diameter, or bronchoconstriction, results in the reduction of gas flow into or out of the lungs and causes difficulty in both spontaneous and mechanical ventilation. A number of factors can trigger bronchospasms, including a foreign body in the airway and stimulation of an endotracheal tube in patients with reactive disease [133] . The Respiratory Model accounts for this respiratory distress by adjusting the resistance of the bronchi units by mapping a user defined severity with an exponential growth function. The increase in bronchial airway resistance results in a decrease in gas flow in and out of the alveoli, which in turn affects the gas concentration in the circulatory system. The engine then responds to the respiratory distress in proportion to the level of bronchoconstriction.
Intubation
The Intubation action sets the type of intubation present: off, tracheal, esophageal, right mainstem, or left mainstem. Tracheal intubation is the successful state. See Anesthesia Machine Methodology for more details about intubation and mechanical ventilation.
Mainstem Intubation
During endotracheal intubation, a flexible tube is inserted orally or nasally down into the trachea to facilitate ventilation of the lungs during mechanical ventilation. A potential complication of endotracheal intubation is mainstem intubation, an incident where the tube is inadvertently placed too deep into one of the two mainstem bronchi. In such incidents, the unintubated lung does not contribute to gas exchange, and a right-to-left shunt can occur, resulting in hypoxia [84] . Furthermore, the intubated lung can be hyperinflated, predisposing to overdistension and barotrauma [84] .
Right mainstem intubation is the common complication of endotracheal intubation because of the shallower angle that the right mainstem bronchus makes with the trachea, though the engine includes the ability to simulate left mainstem intubation as well. The Respiratory Model attempts to simulate this incidence by manipulating the resistance representing the opposite bronchus functional unit of the Respiratory System. A numerically large resistance is selected for this circuit element for complete blockage of flow into the lung. The model then evaluates the physiological responses arising from the incidence.
Esophageal Intubation
Another complication of endotracheal intubation is esophageal intubation, an incident where the endotracheal tube is inadvertently placed in the esophagus. When such an incidence occurs, the lung does not receive air. The Respiratory System models esophageal intubation by opening the airflow path leading to the esophagus and closing the flow path leading to the trachea compartment. This is accomplished in the model by assigning a numerically large value for the tracheal resistance and assigning a small resistance to the esophageal compartment. The lack of airflow into the lungs affects the amount of alveolar-capillary gas exchange, which in turn affects the hemodynamic and respiratory responses of the engine.
Acute Asthma
Asthma is a common inflammatory disease of the airways (bronchi and bronchioles) where air flow into the lungs is partially obstructed. Acute asthma is an exacerbation of asthma that does not respond to standard treatments. Symptoms include elevated respiration rate, labored breathing, and a reduction in oxygen saturation, among others. It is generally considered a life-threatening obstruction of the airway requiring immediate medical attention. During an acute asthma attack, airflow is partially obstructed during exhalation, and flow resistance is 5 to 15 times normal [262] . The engine simulates this by increasing the airway flow resistance in the circuit model. The function used to determine the airway flow resistance multiplier is shown in the figure below. The asthma attack severity is governed by a specified severity value. The higher the severity, the more severe the asthma attack, and the higher the resistance values are set.
Additionally, the inspiratory/expiratory (IE) ratio decreases during an acute asthma attack. It takes a noticeably longer time to exhale than inhale [262] . In the engine, the normal IE ratio is scaled using a multiplier based on severity to model decreased IE ratio during an acute asthma attack.
Tension Pneumothorax
Pneumothorax is an abnormal accumulation of air in the pleural cavity, i.e., a thin space between the visceral and parietal pleura separating lungs from the chest wall, due to factors that cause air to escape into the pleural space. The accumulation of air in the pleural space limits the space available for full lung inflation and increases the intrathoracic pressure, causing a collapse in the ipsilateral lung depending on the type and severity of the incidence. Pneumothoraces are classified as traumatic and nontraumatic or spontaneous based on their cause. Pneuomothoraces are classified as open (sucking chest wound) or closed (intact thoracic cage) pnumothoraces [318] .
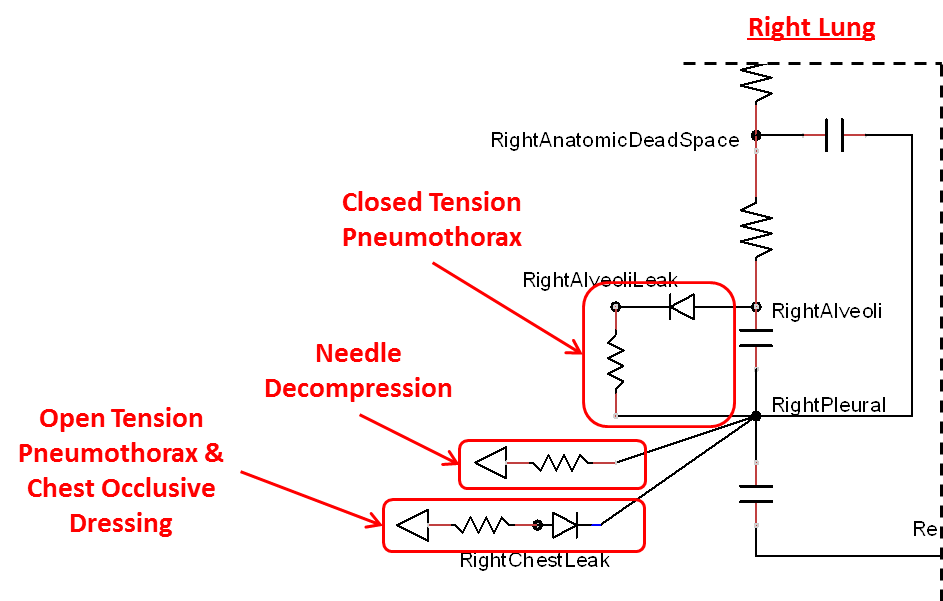
The Respiratory Model is capable of simulating traumatic tension pneumothorax. Tension pneumothorax is a life-threatening condition that occurs when air escapes into the pleural space on inspiration, but cannot return on expiration due to a one-way valve effect of the injury. This causes a progressive build-up of air within the pleural space. The Respiratory System implements a model for tension pneumothorax by including subordinate circuit elements that represent the flow and trapping of air in the pleural space. The circuit elements represent both the open and closed pneumothorax condition. In the open tension pneumothorax condition, air is allowed to enter from the atmosphere into the pleural space as in penetrating chest wound traumas. In the closed tension pneumothorax case, the model allows air to escape from the lung into the plural space as in laceration of the lung following blunt trauma. The model evaluates the physiological responses arising from increased intrapleural pressure and leakage in the airflow of the respiratory circuit.
When a lung collapses (as with pneumothorax), increased pleural cavity pressure pushes on the mediastinum and great veins. As an effect, the mediastinum is displaced and the great veins become kinked, leading to decreased venous return to the heart. This leads to increasing cardiac and respiratory embarrasment [173] . The Cardiovascular model includes a model that maps the pleural cavity pressure difference between the right and left lungs to an increased venous return resistance. This causes the blood pressure to decrease when a pneumothorax is present.
Occlusive Dressing
The management of an open tension pneumothorax requires sealing the open chest wound with an occlusive dressing. Such intervention slows the progression of tension pneumothorax and may ensure recovery if timely intervention takes place. The Respiratory Model simulates occlusive dressing by assigning large flow resistance across the element that serves as an electrical analogue open switch for the path linking the pleural cavity to the environment. Based on this implementation, the model calculates the physiological responses arising from numerical equivalent occlusive dressing.
Needle Decompression
Tension pneumothorax is a life-threatening condition that requires immediate intervention to relieve the air trapped in the pleural space and reduce the intrapleural pressure to the subatmospheric level. Needle decompression is a procedure that allows air to escape from the pleural space into the environment. This procedure relieves the accumulated air, allowing full expansion of the affected lung. The Respiratory Model is capable of simulating needle decompression by incorporating a circuit element that permits airflow based on pressure differential between the pleural space and the environment. The model then evaluates physiological responses to the intervention.
Mechanical Ventilation
Mechanical ventilation allows the user to specify an instantaneous pressure and/or flow value at the respiratory connection point (i.e., mouth). The substance volume fractions at the connection can also be specified. If no volume fractions are given, the ambient values set in the Environment system will be used by default (see Environment Methodology). All settings will remain constant during the simulation, unless removed or modified. This action is likely to be most beneficial implemented in combination with real-world sensors. Manikin or task trainer values can be fed into the the engine to synchronize in real-time.
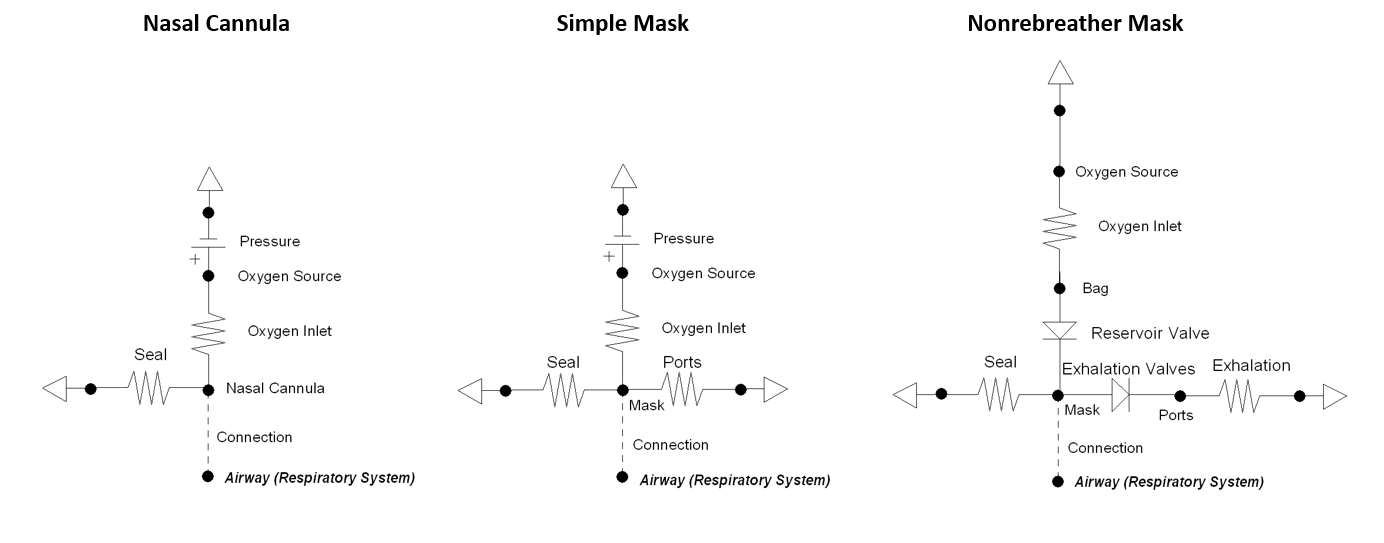
Supplemental Oxygen
The supplemental oxygen action allows the user to provide a higher fraction of inspired oxygen (FiO2) to the patient by selecting one of three different oxygen therapy devices: nasal cannula, simple mask, or non-rebreather mask. The action includes optional settings for oxygen flow rate and bottle volume. If the flow is not explicitly set a default value is applied: nasal cannula = 3.5 L/min, simple mask = 7.5 L/min, non-rebreather mask = 10.0 L/min. The oxygen tank volume is set to a standard value of 425 L, if one is not set. The volume of oxygen is the value that can be provided when depressurized leaving the tank, often referred to as "capacity." The supplemental oxygen action decrements the volume able to be delivered that is remaining in the tank every time-step during simulation. The volume remaining in the tank can be updated by the user anytime while the action is applied.
Each of the three supplemental oxygen devices is modeled using a different lumped parameter circuit that connects directly with the respiratory system - see Figure 20. The nasal cannula and simple mask both have a high pressure source with a high resistance to provide the requested flow of oxygen gas. Replacing this section of the circuit with a flow source proved to be problematic due to ideal circuit laws that dictate the pressure across a current source can be any value. Since the non-rebreather mask uses a very high compliance bag that is continuously filled with oxygen, a pressure source is not needed. The volume of the bag is updated every time-step based on the flow in from the tank and out from inhalation. There is a maximum bag volume of 1 L. A volume below 0 L stops oxygen from flowing out of the bag.
The seal resistance in each circuit dictates how much air escapes due to be secured imperfectly. The nasal cannula has a low seal value to realistically represent the prongs in the patient's nostrils.
Conscious Respiration
Conscious respiration consists of a set of commands that model forced exhalation, forced inhalation, holding breath, and inhaler actuation. Collectively, they allow the engine to model coordinated use of an inhaler. It should be noted that the conscious respiration action begins immediately when called, and will continue until completed while the simulation continues. Users will likely want to advance time for the duration of the conscious respiration command before attempting other actions or completing a scenario. The following commands can be used in any order and will wait until the completion of the previous command to begin:
- Forced Exhale: The "depth" or "shallowness" of the exhalation is determined by the expiratory reserve volume fraction, which specifies what portion of the expiratory reserve volume to exhale. If set to 1.0, the patient exhales his or her entire expiratory reserve volume, leaving only the residual volume in the lungs. The time period over which to execute the exhale is determined by the period.
- Forced Inhale: The "depth" or "shallowness" of the inhalation is determined by the inspiratory capacity fraction, which specifies what portion of the inspiratory capacity to inhale. If set to 1.0, the patient inhales his or her entire inspiratory capacity, completely filling the lungs. The time period over which to execute the inhale is determined by the period.
- Forced Pause: The time period to hold breath at functional residual capacity (0 drive pressure) is determined by the period.
- Use Inhaler: The Inhaler command is interpreted by the inhaler equipment (Inhaler Methodology).
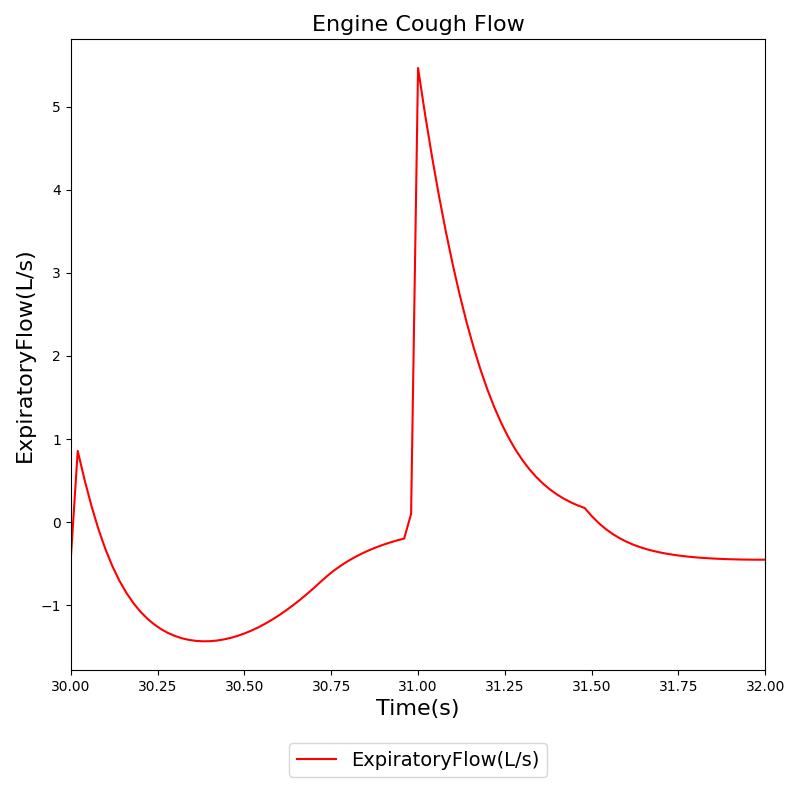
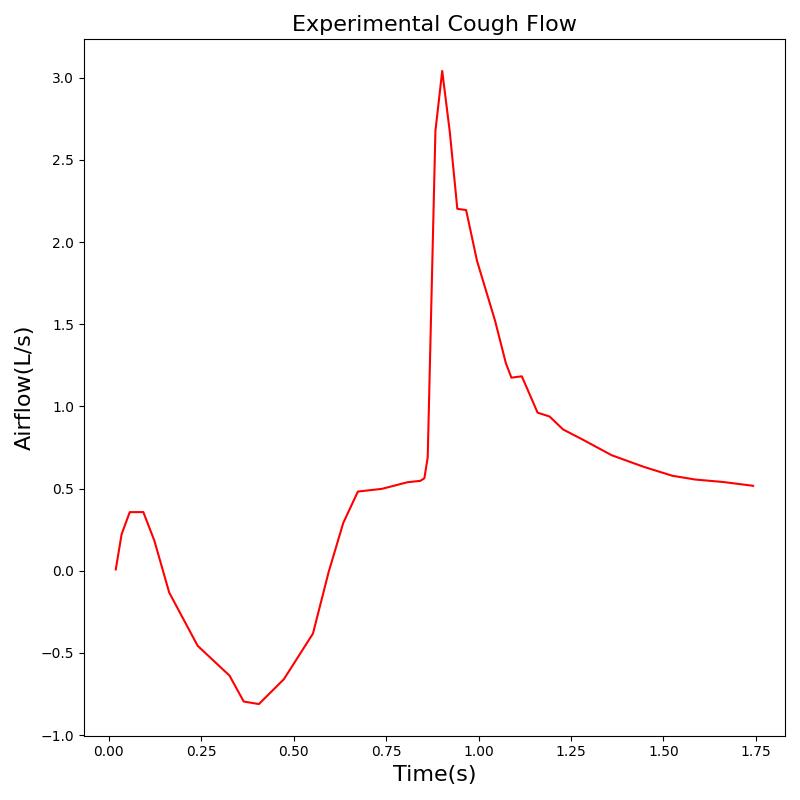
Conscious respiration has any number of potential applications and is likely to be implemented to attain proper breathing while using an inhaler, generate a spirometry curve, or simulate coughing. Figure 21 shows the results for a cough scenario that leverages the conscious respiration action compared to empirical data.
 |
 |
Exacerbations
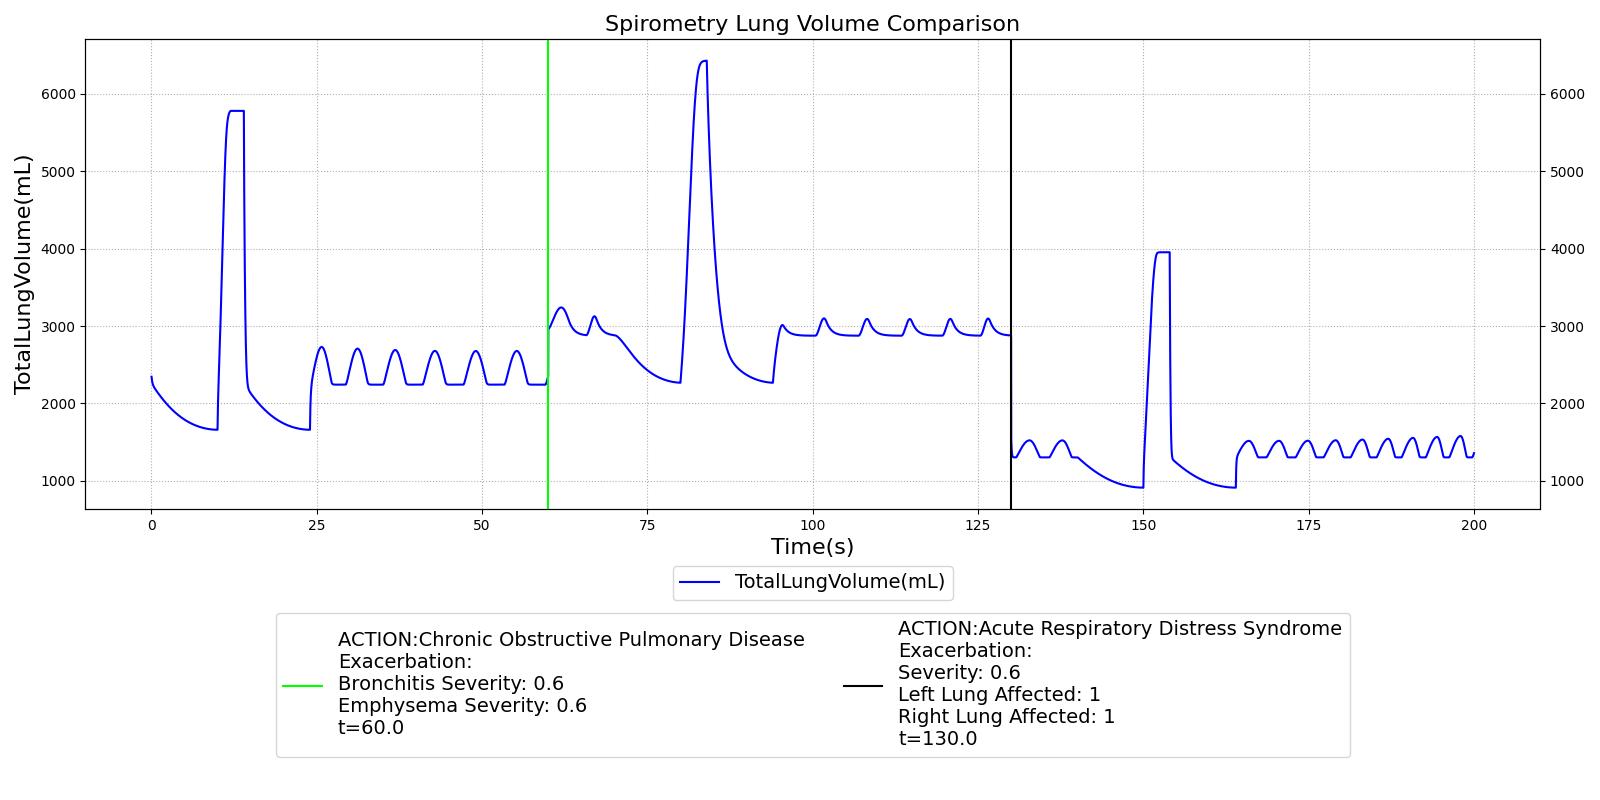
Several respiratory conditions have exacerbation actions defined to allow for increased/decreased severities during runtime, including COPD, ARDS, and Lobar Pneumonia. These exacerbation actions will instantaneously (i.e., during the simulation/scenario runtime) change the values shown in Table 2, based on the severity provided. Exacerbations can either degrade or improve the patient's current condition.
Events
Maximum Pulmonary Ventilation Rate
The Respiratory system triggers Maximum Pulmonary Ventilation Rate event to alert the user when the patient pulmonary ventilation exceeds maximum value.
Bradypnea
Bradypnea is defined as an abnormally low breathing rate. Normal breathing rates for healthy adults are relatively standard, but can vary based upon condition. Low breathing rates can decrease total ventilation if not compensated for, which can lead to hypercapnia or hypoxia. In the engine, bradypnea occurs when the respiratory rate falls below 10 breaths per minute [260] and returns to normal when it rises back above 10.5 breaths per minute.
Tachypnea
Tachypnea is defined as high breathing rate. Normal respiration rate in an adult ranges 12 - 20 breaths per minute. Tachypnea occurs when breathing rate rises above 20 breaths per minute. The engine outputs a tachypnea event when the patient's respiration rate is above 20 breaths per minute.
Respiratory Acidosis
Respiratory acidosis is triggered when the blood pH drops below 7.37. An irreversible state (similar to a death state) is reached when the blood pH drops below 6.5. See Energy Methodology for more details about acidosis.
Respiratory Alkalosis
Respiratory alkalosis is triggered when the blood pH rises above 7.45. An irreversible state (similar to a death state) is reached when the blood pH rises above 8.5. See Energy Methodology for more details about alkalosis.
Results and Conclusions
The Respiratory System was validated quantitatively and qualitatively under resting physiological conditions and transient (action-induced) conditions. The validation is specified with a color coding system, with green indicating good agreement with trends/values, yellow indicating moderate agreement with trends/values, and red indicating poor agreement with trends/values.
Validation - Resting Physiologic State
The Respiratory Model outputs a number of system-level and compartment-level resting physiologic parameters. The tables below compare the values of system- and compartment-level parameters obtained from the model with referenced values. The outputs from the model correspond to the system- and compartment-level respiratory related values of the standard male and female patients under resting physiologic conditions. As shown in Table 3, the majority of the physiological variables show a good match with the literature. The outputs for the major respiratory variables, such as respiration rate, tidal volume, and pulmonary ventilation specifically match well with the reference data.
Standard Male
| Property Name | Expected Value | Engine Value | Percent Error | Notes |
|---|---|---|---|---|
| AirwayPressure(cmH2O) | 1.03e+03 [177] | Mean of 1.03e+03 | -0.3% | Atmospheric Pressure |
| AlveolarArterialGradient(mmHg) | [5,14] [69] | Mean of 22 | 57.1% | |
| AlveolarDeadSpace(mL/kg) | 0.0130 [207] | Mean of 0.0133 | 2.3% | Negligible |
| AnatomicDeadSpace(mL/kg) | 2.00 [207] | Mean of 2.05 | 2.5% | 150mL for standard male |
| ChestWallCompliance(L/cmH2O) | 0.200 [207] | Mean of 0.158 | -21% | |
| EndTidalCarbonDioxidePressure(mmHg) | [35, 45] [207] | Mean of 36.1 | Within bounds | |
| ExpiratoryFlow(L/s) | 0.440 [146] | Maximum of 0.508 | 15.5% | |
| ExpiratoryPulmonaryResistance(cmH2O s/L) | [0.5, 2.5] [177] | Mean of 1.50 | Within bounds | |
| ExpiratoryTidalVolume(mL/kg) | 7.0 [207] | Mean of 7.0 | 0% | |
| FractionOfInsipredOxygen | 0.210 [148] | Mean of 0.210 | 0% | |
| HorowitzIndex(mmHg) | 452 [148] | Mean of 426 | -5.8% | PaO2/FiO2 = 95 mmHg/0.21 |
| InspiratoryExpiratoryRatio | [0.25, 0.50] [207] | Mean of 0.507 | 1.4% | |
| InspiratoryFlow(L/s) | 0.400 [146] | Maximum of 0.457 | 14.2% | |
| InspiratoryPulmonaryResistance(cmH2O s/L) | [0.5, 2.5] [177] | Mean of 1.50 | Within bounds | |
| InspiratoryTidalVolume(mL/kg) | 7.0 [207] | Mean of 7.0 | 0% | |
| IntrapleuralPressure(cmH2O) | -8.00 [207] | Minimum of -7.69 | -3.9% | |
| IntrapleuralPressure(cmH2O) | -5.00 [207] | Maximum of -4.45 | -11% | |
| IntrapulmonaryPressure(cmH2O) | 5.40 [148] | Maximum of 5.80 | 7.4% | |
| IntrapulmonaryPressure(cmH2O) | 0.00 [148] | Minimum of 0.00 | 0% | |
| IntrinsicPositiveEndExpiredPressure(cmH2O) | 0.00 [148] | Minimum of 0.00 | 0% | |
| LungCompliance(L/cmH2O) | 0.200 [207] | Mean of 0.200 | 0% | |
| MaximalInspiratoryPressure(cmH2O) | -1.00 [207] | Mean of -0.684 | -31.6% | |
| MeanAirwayPressure(cmH2O) | 0.00 [177] | Mean of 0.00 | 0% | |
| OxygenationIndex | 0.00 [177] | Mean of 0.00 | 0% | FiO2*MAP*100/PaO2 |
| OxygenSaturationIndex(mmHg) | 0.00 [177] | Mean of 0.00 | 0% | FiO2*MAP*100/SpO2 |
| PeakInspiratoryPressure(cmH2O) | 1.00 [207] | Mean of 0.503 | -49.7% | |
| PhysiologicDeadSpace(mL/kg) | 2.00 [207] | Mean of 2.06 | 3% | |
| PhysiologicDeadSpaceTidalVolumeRatio | [0.20, 0.40] [52] | Mean of 0.296 | Within bounds | |
| PositiveEndExpiratoryPressure(cmH2O) | 0.00 [207] | Mean of 0.00 | 0% | |
| PulmonaryCompliance(L/cmH2O) | [0.06, 0.14] [207] | Mean of 0.0863 | Within bounds | |
| PulmonaryElastance(cmH2O/L) | [7.14, 16.67] [207] | Mean of 11.9 | Within bounds | |
| RelativeTotalLungVolume(L/kg) | 3.50 [207] | Mean of 0.00266 | -99.9% | |
| RespirationRate(1/min) | [12.0, 20.0] [323] | Mean of 12.0 | Within bounds | |
| SaturationAndFractionOfInspiredOxygenRatio | 4.62 [148] | Mean of 4.64 | 0.4% | SpO2/FiO2 = 0.97/0.21 |
| SpecificVentilation | 0.230 [207] | Mean of 0.234 | 1.7% | |
| TidalVolume(mL/kg) | 7.0 [207] | Mean of 7.0 | 0% | |
| TotalAlveolarVentilation(L/min/kg) | 0.0800 [207] | Mean of 0.0837 | 4.6% | |
| TotalDeadSpaceVentilation(L/min/kg) | 0.0240 [207] | Mean of 0.0248 | 3.3% | |
| TotalLungVolume(L/kg) | 0.0335 [207] | Mean of 0.0324 | -3.3% | |
| TotalPulmonaryVentilation(L/min/kg) | 0.0840 [207] | Mean of 0.0837 | -0.4% | |
| TransairwayPressure(cmH2O) | -1.00 [207] | Minimum of -0.762 | -23.8% | |
| TransairwayPressure(cmH2O) | 1.00 [207] | Maximum of 0.685 | -31.5% | |
| TransalveolarPressure(cmH2O) | 5.20 [148] | Minimum of 4.92 | -5.4% | |
| TransalveolarPressure(cmH2O) | 7.20 [148] | Maximum of 7.54 | 4.7% | |
| TransChestWallPressure(cmH2O) | -8.00 [207] | Minimum of -7.69 | -3.9% | |
| TransChestWallPressure(cmH2O) | -5.00 [207] | Maximum of -4.45 | -11% | |
| TransMusclePressure(cmH2O) | -5.40 [148] | Minimum of -5.80 | 7.4% | |
| TransMusclePressure(cmH2O) | 0.00 [148] | Maximum of 0.00 | 0% | |
| TranspulmonaryPressure(cmH2O) | 5.00 [148] | Minimum of 4.45 | -11% | |
| TranspulmonaryPressure(cmH2O) | 7.50 [148] | Maximum of 7.69 | 2.5% | |
| TransrespiratoryPressure(cmH2O) | 0.00 [177] | Minimum of 0.00 | 0% | No assistance (e.g., mechanical ventilator) |
| TransrespiratoryPressure(cmH2O) | 0.00 [177] | Maximum of 0.00 | 0% | No assistance (e.g., mechanical ventilator) |
| TransthoracicPressure(cmH2O) | -1.00 [207] | Minimum of -0.685 | -31.5% | |
| TransthoracicPressure(cmH2O) | 1.00 [207] | Maximum of 0.762 | -23.8% | |
| VentilationPerfusionRatio | [0.8, 1.0] [369] | Mean of 1.11 | 11% |
Standard Female
| Property Name | Expected Value | Engine Value | Percent Error | Notes |
|---|---|---|---|---|
| AirwayPressure(cmH2O) | 1.03e+03 [177] | Mean of 1.03e+03 | -0.3% | Atmospheric Pressure |
| AlveolarArterialGradient(mmHg) | [5,14] [69] | Mean of 23 | 64.3% | |
| AlveolarDeadSpace(mL/kg) | 0.0130 [207] | Mean of 0.0133 | 2.3% | Negligible |
| AnatomicDeadSpace(mL/kg) | 2.00 [207] | Mean of 2.16 | 8% | 150mL for standard male |
| ChestWallCompliance(L/cmH2O) | 0.200 [207] | Mean of 0.139 | -30.5% | |
| EndTidalCarbonDioxidePressure(mmHg) | [35, 45] [207] | Mean of 35.8 | Within bounds | |
| ExpiratoryFlow(L/s) | 0.440 [146] | Maximum of 0.407 | -7.5% | |
| ExpiratoryPulmonaryResistance(cmH2O s/L) | [0.5, 2.5] [177] | Mean of 1.50 | Within bounds | |
| ExpiratoryTidalVolume(mL/kg) | 7.0 [207] | Mean of 7.7 | 10% | |
| FractionOfInsipredOxygen | 0.210 [148] | Mean of 0.210 | 0% | |
| HorowitzIndex(mmHg) | 452 [148] | Mean of 429 | -5.1% | PaO2/FiO2 = 95 mmHg/0.21 |
| InspiratoryExpiratoryRatio | [0.25, 0.50] [207] | Mean of 0.504 | 0.8% | |
| InspiratoryFlow(L/s) | 0.400 [146] | Maximum of 0.366 | -8.5% | |
| InspiratoryPulmonaryResistance(cmH2O s/L) | [0.5, 2.5] [177] | Mean of 1.50 | Within bounds | |
| InspiratoryTidalVolume(mL/kg) | 7.0 [207] | Mean of 7.7 | 10% | |
| IntrapleuralPressure(cmH2O) | -8.00 [207] | Minimum of -7.15 | -10.6% | |
| IntrapleuralPressure(cmH2O) | -5.00 [207] | Maximum of -4.54 | -9.2% | |
| IntrapulmonaryPressure(cmH2O) | 5.40 [148] | Maximum of 4.95 | -8.3% | |
| IntrapulmonaryPressure(cmH2O) | 0.00 [148] | Minimum of 0.00 | 0% | |
| IntrinsicPositiveEndExpiredPressure(cmH2O) | 0.00 [148] | Minimum of 0.00 | 0% | |
| LungCompliance(L/cmH2O) | 0.200 [207] | Mean of 0.200 | 0% | |
| MaximalInspiratoryPressure(cmH2O) | -1.00 [207] | Mean of -0.546 | -45.4% | |
| MeanAirwayPressure(cmH2O) | 0.00 [177] | Mean of 0.00 | 0% | |
| OxygenationIndex | 0.00 [177] | Mean of 0.00 | 0% | FiO2*MAP*100/PaO2 |
| OxygenSaturationIndex(mmHg) | 0.00 [177] | Mean of 0.00 | 0% | FiO2*MAP*100/SpO2 |
| PeakInspiratoryPressure(cmH2O) | 1.00 [207] | Mean of 0.451 | -54.9% | |
| PhysiologicDeadSpace(mL/kg) | 2.00 [207] | Mean of 2.17 | 8.5% | |
| PhysiologicDeadSpaceTidalVolumeRatio | [0.20, 0.40] [52] | Mean of 0.282 | Within bounds | |
| PositiveEndExpiratoryPressure(cmH2O) | 0.00 [207] | Mean of 0.00 | 0% | |
| PulmonaryCompliance(L/cmH2O) | [0.06, 0.14] [207] | Mean of 0.0793 | Within bounds | |
| PulmonaryElastance(cmH2O/L) | [7.14, 16.67] [207] | Mean of 12.9 | Within bounds | |
| RelativeTotalLungVolume(L/kg) | 3.50 [207] | Mean of 0.00292 | -99.9% | |
| RespirationRate(1/min) | [12.0, 20.0] [323] | Mean of 12.0 | Within bounds | |
| SaturationAndFractionOfInspiredOxygenRatio | 4.62 [148] | Mean of 4.64 | 0.4% | SpO2/FiO2 = 0.97/0.21 |
| SpecificVentilation | 0.230 [207] | Mean of 0.259 | 12.6% | |
| TidalVolume(mL/kg) | 7.0 [207] | Mean of 7.7 | 10% | |
| TotalAlveolarVentilation(L/min/kg) | 0.0800 [207] | Mean of 0.0927 | 15.9% | |
| TotalDeadSpaceVentilation(L/min/kg) | 0.0240 [207] | Mean of 0.0261 | 8.8% | |
| TotalLungVolume(L/kg) | 0.0335 [207] | Mean of 0.0327 | -2.4% | |
| TotalPulmonaryVentilation(L/min/kg) | 0.0840 [207] | Mean of 0.0927 | 10.4% | |
| TransairwayPressure(cmH2O) | -1.00 [207] | Minimum of -0.610 | -39% | |
| TransairwayPressure(cmH2O) | 1.00 [207] | Maximum of 0.549 | -45.1% | |
| TransalveolarPressure(cmH2O) | 5.20 [148] | Minimum of 4.93 | -5.2% | |
| TransalveolarPressure(cmH2O) | 7.20 [148] | Maximum of 7.04 | -2.2% | |
| TransChestWallPressure(cmH2O) | -8.00 [207] | Minimum of -7.15 | -10.6% | |
| TransChestWallPressure(cmH2O) | -5.00 [207] | Maximum of -4.54 | -9.2% | |
| TransMusclePressure(cmH2O) | -5.40 [148] | Minimum of -4.95 | -8.3% | |
| TransMusclePressure(cmH2O) | 0.00 [148] | Maximum of 0.00 | 0% | |
| TranspulmonaryPressure(cmH2O) | 5.00 [148] | Minimum of 4.54 | -9.2% | |
| TranspulmonaryPressure(cmH2O) | 7.50 [148] | Maximum of 7.15 | -4.7% | |
| TransrespiratoryPressure(cmH2O) | 0.00 [177] | Minimum of 0.00 | 0% | No assistance (e.g., mechanical ventilator) |
| TransrespiratoryPressure(cmH2O) | 0.00 [177] | Maximum of 0.00 | 0% | No assistance (e.g., mechanical ventilator) |
| TransthoracicPressure(cmH2O) | -1.00 [207] | Minimum of -0.549 | -45.1% | |
| TransthoracicPressure(cmH2O) | 1.00 [207] | Maximum of 0.610 | -39% | |
| VentilationPerfusionRatio | [0.8, 1.0] [369] | Mean of 1.01 | 1% |
Standard Male
| Property Name | Expected Value | Engine Value | Percent Error | Notes |
|---|---|---|---|---|
| Carina-Pressure(cmH2O) | [1033.2, 1034.2] [148] | Maximum of 1033.8 | Within bounds | Assume Patm = 1033.2 cmH2O |
| Carina-Pressure(cmH2O) | [1032.2, 1033.2] [148] | Minimum of 1032.7 | Within bounds | Assume Patm = 1033.2 cmH2O |
| Carina-Oxygen-PartialPressure(mmHg) | [149.0 [207], 160.0 [323]] | Maximum of 159.6 | Within bounds | |
| Carina-Oxygen-PartialPressure(mmHg) | 120.0 [207] | Minimum of 114.7 | -4.4% | |
| Carina-CarbonDioxide-PartialPressure(mmHg) | [27.0, 43.0] [207] | Maximum of 36.4 | Within bounds | |
| Carina-CarbonDioxide-PartialPressure(mmHg) | [0.235 [323], 0.3 [207]] | Minimum of 0.306 | 2% | |
| LeftPleuralCavity-Pressure(cmH2O) | 1028.2 [148] | Maximum of 1028.8 | 0.1% | Assume Patm = 1033.2 cmH2O |
| LeftPleuralCavity-Pressure(cmH2O) | 1025.7 [148] | Minimum of 1025.6 | -0% | Assume Patm = 1033.2 cmH2O |
| RightPleuralCavity-Pressure(cmH2O) | 1028.2 [148] | Maximum of 1028.8 | 0.1% | Assume Patm = 1033.2 cmH2O |
| RightPleuralCavity-Pressure(cmH2O) | 1025.7 [148] | Minimum of 1025.5 | -0% | Assume Patm = 1033.2 cmH2O |
| PulmonaryLungs-Volume(L) | 0.030 [207] | Minimum of 0.030 | 0% | |
| PulmonaryLungs-Volume(L) | 0.037 [207] | Maximum of 0.037 | 0% | |
| LeftLungPulmonary-Pressure(cmH2O) | [1034.0, 1038.2] [258] | Maximum of 1034.0 | Within bounds | Assume Patm = 1033.2 cmH2O |
| LeftLungPulmonary-Pressure(cmH2O) | [1028.2, 1032.4] [258] | Minimum of 1032.5 | 0% | Assume Patm = 1033.2 cmH2O |
| RightLungPulmonary-Pressure(cmH2O) | [1034.0, 1038.2] [258] | Maximum of 1034.0 | Within bounds | Assume Patm = 1033.2 cmH2O |
| RightLungPulmonary-Pressure(cmH2O) | [1028.2, 1032.4] [258] | Minimum of 1032.5 | 0% | Assume Patm = 1033.2 cmH2O |
| LeftAlveoli-Volume(L) | 0.0126 [207] | Minimum of 0.0132 | 4.8% | |
| LeftAlveoli-Volume(L) | 0.0158 [207] | Maximum of 0.0166 | 5.1% | |
| LeftAlveoli-Pressure(cmH2O) | [1034.0, 1038.2] [258] | Maximum of 1034.0 | Within bounds | Assume Patm = 1033.2 cmH2O |
| LeftAlveoli-Pressure(cmH2O) | [1028.2, 1032.4] [258] | Minimum of 1032.5 | 0% | Assume Patm = 1033.2 cmH2O |
| LeftAlveoli-Oxygen-PartialPressure(mmHg) | [98.0 [323], 104.0 [207]] | Mean of 113.3 | 8.9% | |
| LeftAlveoli-CarbonDioxide-PartialPressure(mmHg) | [40.0 [323], 54.4 [212]] | Mean of 38.1 | -4.7% | |
| RightAlveoli-Volume(L) | 0.0154 [207] | Minimum of 0.0146 | -5.2% | |
| RightAlveoli-Volume(L) | 0.0193 [207] | Maximum of 0.0181 | -6.2% | |
| RightAlveoli-Pressure(cmH2O) | [1034.0, 1038.2] [258] | Maximum of 1034.0 | Within bounds | Assume Patm = 1033.2 cmH2O |
| RightAlveoli-Pressure(cmH2O) | [1028.2, 1032.4] [258] | Minimum of 1032.5 | 0% | Assume Patm = 1033.2 cmH2O |
| RightAlveoli-Oxygen-PartialPressure(mmHg) | [98.0 [323], 104.0 [207]] | Mean of 110.5 | 6.2% | |
| RightAlveoli-CarbonDioxide-PartialPressure(mmHg) | [40.0 [323], 54.4 [212]] | Mean of 39.1 | -2.2% | |
| LeftAnatomicDeadSpace-Volume(L/kg) | 0.00090 [207] | Mean of 0.00097 | 7.8% | |
| LeftAnatomicDeadSpace-Oxygen-PartialPressure(mmHg) | [104.0, 149.0] [207] | Mean of 130.2 | Within bounds | |
| LeftAnatomicDeadSpace-CarbonDioxide-PartialPressure(mmHg) | [0.03, 40.0] [207] | Mean of 24.3 | Within bounds | |
| RightAnatomicDeadSpace-Volume(L/kg) | 0.0011 [207] | Mean of 0.0011 | 0% | |
| RightAnatomicDeadSpace-Oxygen-PartialPressure(mmHg) | [104.0, 149.0] [207] | Mean of 128.6 | Within bounds | |
| RightAnatomicDeadSpace-CarbonDioxide-PartialPressure(mmHg) | [0.03, 40.0] [207] | Mean of 24.9 | Within bounds |
Standard Female
| Property Name | Expected Value | Engine Value | Percent Error | Notes |
|---|---|---|---|---|
| Carina-Pressure(cmH2O) | [1033.2, 1034.2] [148] | Maximum of 1033.7 | Within bounds | Assume Patm = 1033.2 cmH2O |
| Carina-Pressure(cmH2O) | [1032.2, 1033.2] [148] | Minimum of 1032.8 | Within bounds | Assume Patm = 1033.2 cmH2O |
| Carina-Oxygen-PartialPressure(mmHg) | [149.0 [207], 160.0 [323]] | Maximum of 159.6 | Within bounds | |
| Carina-Oxygen-PartialPressure(mmHg) | 120.0 [207] | Minimum of 116.3 | -3.1% | |
| Carina-CarbonDioxide-PartialPressure(mmHg) | [27.0, 43.0] [207] | Maximum of 35.9 | Within bounds | |
| Carina-CarbonDioxide-PartialPressure(mmHg) | [0.235 [323], 0.3 [207]] | Minimum of 0.305 | 1.7% | |
| LeftPleuralCavity-Pressure(cmH2O) | 1028.2 [148] | Maximum of 1028.7 | 0% | Assume Patm = 1033.2 cmH2O |
| LeftPleuralCavity-Pressure(cmH2O) | 1025.7 [148] | Minimum of 1026.1 | 0% | Assume Patm = 1033.2 cmH2O |
| RightPleuralCavity-Pressure(cmH2O) | 1028.2 [148] | Maximum of 1028.7 | 0% | Assume Patm = 1033.2 cmH2O |
| RightPleuralCavity-Pressure(cmH2O) | 1025.7 [148] | Minimum of 1026.1 | 0% | Assume Patm = 1033.2 cmH2O |
| PulmonaryLungs-Volume(L) | 0.030 [207] | Minimum of 0.030 | 0% | |
| PulmonaryLungs-Volume(L) | 0.037 [207] | Maximum of 0.037 | 0% | |
| LeftLungPulmonary-Pressure(cmH2O) | [1034.0, 1038.2] [258] | Maximum of 1033.8 | -0% | Assume Patm = 1033.2 cmH2O |
| LeftLungPulmonary-Pressure(cmH2O) | [1028.2, 1032.4] [258] | Minimum of 1032.7 | 0% | Assume Patm = 1033.2 cmH2O |
| RightLungPulmonary-Pressure(cmH2O) | [1034.0, 1038.2] [258] | Maximum of 1033.8 | -0% | Assume Patm = 1033.2 cmH2O |
| RightLungPulmonary-Pressure(cmH2O) | [1028.2, 1032.4] [258] | Minimum of 1032.7 | 0% | Assume Patm = 1033.2 cmH2O |
| LeftAlveoli-Volume(L) | 0.0126 [207] | Minimum of 0.0131 | 4% | |
| LeftAlveoli-Volume(L) | 0.0158 [207] | Maximum of 0.0169 | 7% | |
| LeftAlveoli-Pressure(cmH2O) | [1034.0, 1038.2] [258] | Maximum of 1033.8 | -0% | Assume Patm = 1033.2 cmH2O |
| LeftAlveoli-Pressure(cmH2O) | [1028.2, 1032.4] [258] | Minimum of 1032.7 | 0% | Assume Patm = 1033.2 cmH2O |
| LeftAlveoli-Oxygen-PartialPressure(mmHg) | [98.0 [323], 104.0 [207]] | Mean of 115.0 | 10.6% | |
| LeftAlveoli-CarbonDioxide-PartialPressure(mmHg) | [40.0 [323], 54.4 [212]] | Mean of 37.6 | -6% | |
| RightAlveoli-Volume(L) | 0.0154 [207] | Minimum of 0.0145 | -5.8% | |
| RightAlveoli-Volume(L) | 0.0193 [207] | Maximum of 0.0184 | -4.7% | |
| RightAlveoli-Pressure(cmH2O) | [1034.0, 1038.2] [258] | Maximum of 1033.8 | -0% | Assume Patm = 1033.2 cmH2O |
| RightAlveoli-Pressure(cmH2O) | [1028.2, 1032.4] [258] | Minimum of 1032.7 | 0% | Assume Patm = 1033.2 cmH2O |
| RightAlveoli-Oxygen-PartialPressure(mmHg) | [98.0 [323], 104.0 [207]] | Mean of 112.4 | 8.1% | |
| RightAlveoli-CarbonDioxide-PartialPressure(mmHg) | [40.0 [323], 54.4 [212]] | Mean of 38.5 | -3.8% | |
| LeftAnatomicDeadSpace-Volume(L/kg) | 0.00090 [207] | Mean of 0.0010 | 11.1% | |
| LeftAnatomicDeadSpace-Oxygen-PartialPressure(mmHg) | [104.0, 149.0] [207] | Mean of 131.2 | Within bounds | |
| LeftAnatomicDeadSpace-CarbonDioxide-PartialPressure(mmHg) | [0.03, 40.0] [207] | Mean of 24.0 | Within bounds | |
| RightAnatomicDeadSpace-Volume(L/kg) | 0.0011 [207] | Mean of 0.0011 | 0% | |
| RightAnatomicDeadSpace-Oxygen-PartialPressure(mmHg) | [104.0, 149.0] [207] | Mean of 129.7 | Within bounds | |
| RightAnatomicDeadSpace-CarbonDioxide-PartialPressure(mmHg) | [0.03, 40.0] [207] | Mean of 24.5 | Within bounds |
Scenario Validation
The actions and interventions associated with the Respiratory System were validated quantitatively where possible and qualitatively elsewhere by comparing the engine output to expected trends and values. For each scenario, the table shows the total number of results in each category. For many investigated scenarios, the model shows good agreement with the expected trends. For the scenarios that did not match with the expected trends, improvements are planned for future engine releases. Many of the parameters that do not meet validation are specific to the cardiovascular system, including heart rate and blood pressures.
Table 5. Cumulative validation results for Respiratory specific conditions and actions scenarios.
| Key |
|---|
| Good agreement: correct trends or <10% deviation from expected |
| Some deviation: correct trend and/or <30% deviation from expected |
| Poor agreement: incorrect trends or >30% deviation from expected |
| Scenario | Description | Good | Decent | Bad |
|---|---|---|---|---|
| AsthmaAttackModerateAcute | Moderate acute asthma attack | 18 | 0 | 0 |
| AsthmaAttackSevereAcute | Severe acute asthma attack | 13 | 3 | 2 |
| AsthmaAttackLifeThreateningAcute | Life threatening acute asthma attack | 16 | 3 | 0 |
| COPDSevereEmphysema | GOLD Stage III Emphysema | 5 | 3 | 1 |
| COPDSevereBronchitisLeft | Severe Chronic Bronchitis | 7 | 1 | 1 |
| ARDSModerateBothLungs | Moderate Acute Respiratory Distress Syndrome | 9 | 0 | 0 |
| LobarPneumoniaSevereLeftLobe | Severe Lobar Pneumonia in one lobe in the left lung | 2 | 5 | 2 |
| LobarPneumoniaSevereRightLung | Severe Lobar Pneumonia in two lobes of right lung | 6 | 1 | 2 |
| LobarPneumoniaModerateBothLungs | Moderate Lobar Pneumonia in both lungs | 6 | 1 | 2 |
| PulmonaryFibrosisSevere | Severe Pulmonary Fibrosis | 7 | 1 | 1 |
| TensionPneumothoraxOpenVaried | Varied open pneumothorax severities and interventions | 40 | 1 | 1 |
| TensionPneumothoraxClosedVaried | Varied closed pneumothorax severities and interventions | 32 | 1 | 2 |
| AirwayObstructionVaried | Airway Obstruction with varying severities | 27 | 0 | 3 |
| Bronchoconstriction | Bronchoconstriction with varying severities | 25 | 0 | 5 |
| MainstemIntubation | Right and left mainstem intubation and correction (with Succs) | 20 | 0 | 0 |
| EsophagealIntubation | Esophageal intubation and correction (with Succs) | 10 | 0 | 0 |
| Dyspnea | Varied severities of respiratory apnea | 6 | 0 | 0 |
| Supplemental Oxygen | Nasal cannula, simple mask, and non-rebreather mask | 3 | 0 | 0 |
| Total | 252 | 20 | 22 |
Validation - Conditions
COPD
The COPD condition was validated against two scenarios. The severe emphysema scenario (Emphysema Severity = 0.7, Bronchitis Severity = 0.5) attempts to model Gold Stage III Emphysema.
Table 6. Validation matrix for severe emphysema. This condition corresponds to GOLD Stage III COPD [219] [267] . The table shows the engine output compared to validation data for respiratory and hemodynamic values.
| Segment | Notes | Sampled Scenario Time (s) | Trachea Flow - Peak Expiratory Flow (L/min) | Respiration Rate (breaths/min) | Tidal Volume (mL) | Heart Rate (beats/min) | Systolic Pressure (mmHg) | Oxygen Saturation | PaO2 (mmHg) | PaCO2 (mmHg) | IERatio |
|---|---|---|---|---|---|---|---|---|---|---|---|
| Severe Emphysema: Bronchitis Severity = 0.5 Emphysema Severity = 0.7 Both Lungs 100% | GOLD Stage III | 120 | < 70% of Normal [267] | Increase, Tachypnea, Dyspnea, > 30 [145] | < 60% of normal [145] | Increase, Tachycardia | Increase, Pulmonary Hypertension , > 140 mm Hg [178], [314] | < 90% [219]; < 89% [178] | Decrease, Hypoxemia [178]; < 55 mm Hg [219], [178] | Increase, Hypercapnia, > 55 mmHg [178] | Decrease [366] |
Table 7. Validation matrix for severe chronic bronchitis. The table shows the engine output compared to validation data for respiratory and hemodynamic values.
| Segment | Notes | Sampled Scenario Time (s) | Trachea Flow - Peak Expiratory Flow (L/min) | Respiration Rate (breaths/min) | Tidal Volume (mL) | Heart Rate (beats/min) | Systolic Pressure (mmHg) | Oxygen Saturation | PaO2 (mmHg) | PaCO2 (mmHg) | IERatio |
|---|---|---|---|---|---|---|---|---|---|---|---|
| Severe Chronic Bronchitis: Bronchitis Severity = 0.65 Emphysema Severity = 0.5 Both Lungs 100% | 120 | Decrease [226] | > 20 [226] | < 60% of normal [226] | Increase, Tachycardia [226] | Increase, Pulmonary Hypertension, > 140 mm Hg [226] | < 90% [226] | Decrease, Hypoxemia, < 55 mm Hg [226] | Increase, Hypercapnia > 55 mmHg [226] | Decrease [366], [226] |
Acute Respiratory Distress Syndrome
The ARDS condition was validated against a moderate severity scenario. Further validation of ARDS while ventilated can be found in the Mechanical Ventilator Methodology validation.
Table 8. Validation matrix for moderate ARDS in both lungs. The table shows the engine output compared to validation data for respiratory and hemodynamic values.
| Segment | Notes | Sampled Scenario Time (s) | Pulmonary Compliance (L/cmH2O) | Respiration Rate (breaths/min) | Shunt Fraction | Heart Rate (beats/min) | Total Pulmonary Ventilation (L/min) | Oxygen Saturation | PaO2 (mmHg) | PaCO2 (mmHg) | Horowitz Index [PaO2/FiO2] (mmHg) |
|---|---|---|---|---|---|---|---|---|---|---|---|
| Moderate ARDS Severity = 0.6 Left Lung = 100% Right Lung = 100% | Chronic condition | 120 | Reduced [232] | Tachypnea [232] | >20% [279] | Tachycardia [232] | Increased @ cite mortelliti2002acute | Hypoxia [232] | Hypoxemia [279] | Normal or near normal [232] | <300 [232] |
Lobar Pneumonia
The lobar pneumonia condition was validated against three scenarios; severe pneumonia in the one lobe of the left lung (Severity = 0.7), severe pneumonia in two lobes of the right lung (Severity = 0.7), and moderate pneumonia in both lungs (Severity = 0.2). The engine does not model the discrete lobes of each lung, so infected-lobe behavior is modeled by applying pneumonia severity against a fraction of each lung. The fraction approximates the portion of the lung (by volume) that the lobe(s) occupy. In the case of the left lung, there are two lobes. Each lobe constitutes approximately 50% of the whole lung. It is understood that the actual volume distribution is not equal for the two lobes, but we use this as an approximation. The same is true for the right lung, which has three lobes. Increasing core body temperature is also a symptom of lobar pneumonia that fails to agree with the validation data. However, we expected this disagreement since the engine doesn't currently model elevated body temperature in response to infection. This is something we plan to address in future releases.
Table 8. Validation matrix for severe lobar pneumonia concentrated in one lobe in the left lung. The table shows the engine output compared to validation data for respiratory and hemodynamic values.
| Condition | Notes | Sampled Scenario Time (s) | Respiration Rate (breaths/min) | Tidal Volume (mL) | Heart Rate (beats/min) | Systolic Pressure (mmHg) | Oxygen Saturation | PaO2 (mmHg) | PaCO2 (mmHg) | IERatio | Core Body Temperature (Degrees C) |
|---|---|---|---|---|---|---|---|---|---|---|---|
| Severe Lobar Pneumonia: Severity = 0.70 Left Lung = 50% Right Lung = 0% | Severe Lobar Pneumonia in one lobe in the left lung. Current model does not include metabolic effects. | 120 | Increase, Tachypnea, Dyspnea > 20 [94] | Decrease [226] | Increase, Tachycardia, > 100 [94] | Decrease, < 90 mm Hg [119] | Decrease , < 95% [216] | Decrease, Hypoxemia [119] < 60 mm Hg | Increase [226] | Decrease [226] | Increase, > 37.8 C (100 F) [94] |
Table 9. Validation matrix for severe lobar pneumonia concentrated in two lobes in the right lung. The table shows the engine output compared to validation data for respiratory and hemodynamic values.
| Condition | Notes | Sampled Scenario Time (s) | Respiration Rate (breaths/min) | Tidal Volume (mL) | Heart Rate (beats/min) | Systolic Pressure (mmHg) | Oxygen Saturation | PaO2 (mmHg) | PaCO2 (mmHg) | IERatio | Core Body Temperature (Degrees C) |
|---|---|---|---|---|---|---|---|---|---|---|---|
| Severe Lobar Pneumonia: Right Lung Severity = 0.70 Left Lung = 0% Right Lung = 67% | Severe lobar pneumonia in two lobes of the right lung. Current model does not include metabolic effects. | 120 | Increase, Tachypnea, Dypsnea > 20 [94] | Decrease [226] | Increase, Tachycardia, > 100 [94] | Decrease, < 90 mm Hg [119] | Decrease , < 95% [216] | Decrease, Hypoxemia [119] < 60 mm Hg | Increase [226] | Decrease [226] | Increase, > 37.8 C (100 F) [94] |
Table 10. Validation matrix for moderate lobar pneumonia in both lungs. The table shows the engine output compared to validation data for respiratory and hemodynamic values.
| Condition | Notes | Sampled Scenario Time (s) | Respiration Rate (breaths/min) | Tidal Volume (mL) | Heart Rate (beats/min) | Systolic Pressure (mmHg) | Oxygen Saturation | PaO2 (mmHg) | PaCO2 (mmHg) | IERatio | Core Body Temperature (Degrees C) |
|---|---|---|---|---|---|---|---|---|---|---|---|
| Moderate Lober: Pneumonia Severity = 0.2 Left Lung = 100% Right Lung = 100% | Moderate pneumonia in both lungs. Current model does not include metabolic effects. | 120 | Increase, Tachypnea, Dypsnea > 20 [94] | Decrease [226] | Increase, Tachycardia, > 100 [94] | Decrease, < 90 mm Hg [119] | Decrease , < 95% [216] | Decrease, Hypoxemia [119] < 60 mm Hg | Increase [226] | Decrease [226] | Increase, > 37.8 C (100 F) [94] |
Pulmonary Fibrosis
The pulmonary fibrosis condition was validated with a severe pulmonary fibrosis scenario by applying a severity of 0.9 to the patient.The severity decreased the lung compliance and increased the airway resistance making it difficult to breathe.The resulting outputs are shown in Table 11 for common clinical parameters.
Table 11. Validation matrix for severe pulmonary fibrosis. The table shows the engine output compared to validation data for respiratory and hemodynamic values.
| Segment | Notes | Sampled Scenario Time (s) | Trachea Flow - Peak Expiratory Flow (L/min) | Respiration Rate (breaths/min) | Tidal Volume (mL) | Heart Rate (beats/min) | Systolic Pressure (mmHg) | Oxygen Saturation | PaO2 (mmHg) | PaCO2 (mmHg) | IERatio |
|---|---|---|---|---|---|---|---|---|---|---|---|
| Severe Pulmonary Fibrosis | Severity = 0.9 | 120 | Decreases | Increase, Tachypnea, > 30 [145] | Dyspnea, < 60% of normal [240], [145] | Increase, Tachycardia | Increase, Pulmonary Hypertension, > 140 mm Hg [280] | < 90% | Decrease, Hypoxemia [70] | Increase, Hypercapnia | Decrease |
Validation - Actions
Airway Obstruction
The airway obstruction action was validated with a scenario that applies varying severities of 0.3, 0.6, and 1.0. Varying the severity of the obstruction simulates partial obstructions and a complete obstruction. The severity levels logarithmically increase the airway resistance. The resulting outputs from the engine are shown in Table 12 for common clinical parameters.
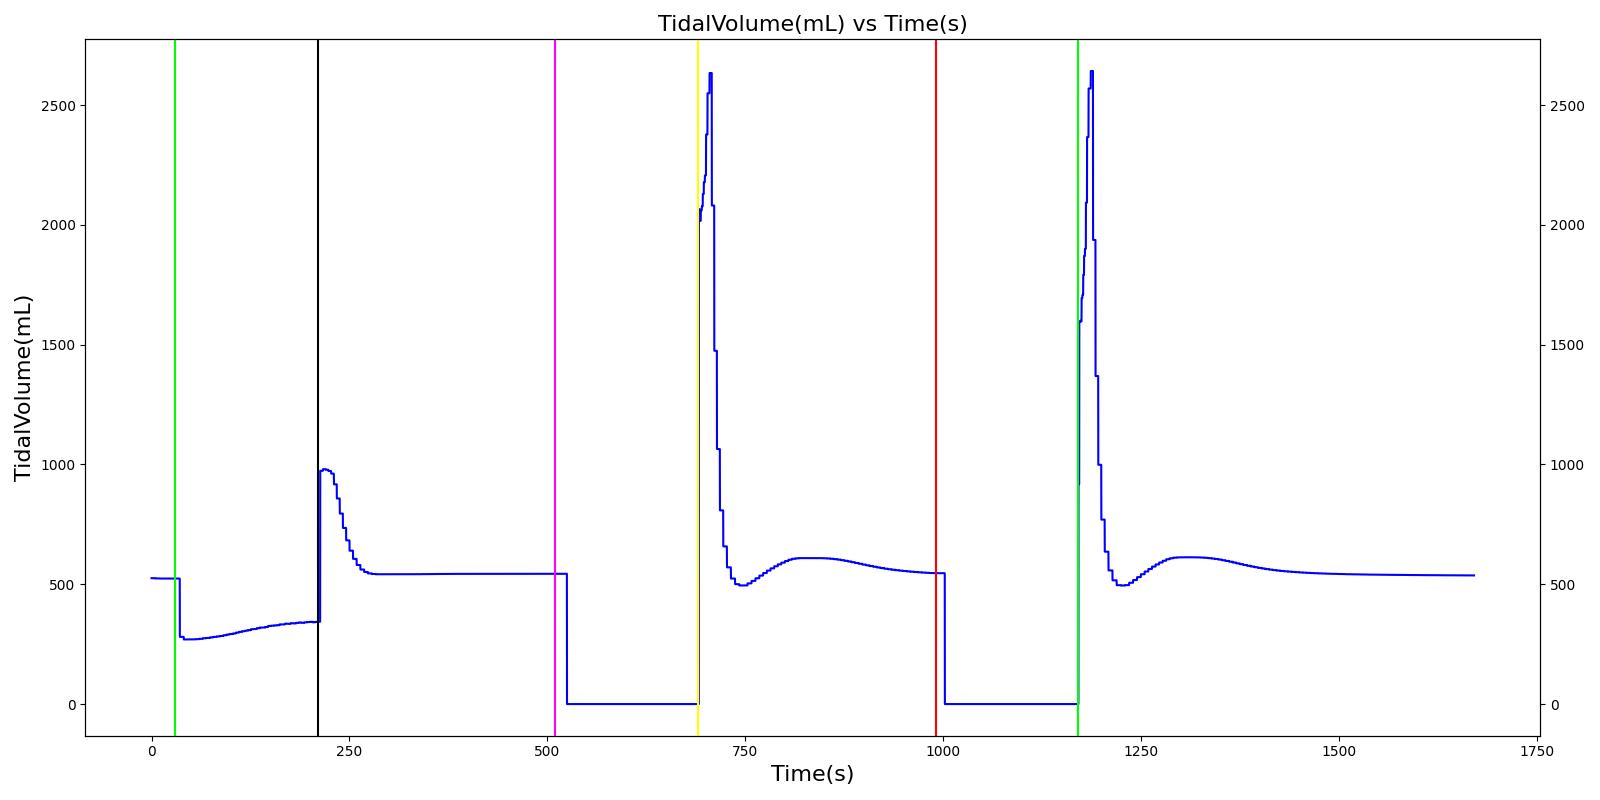 |
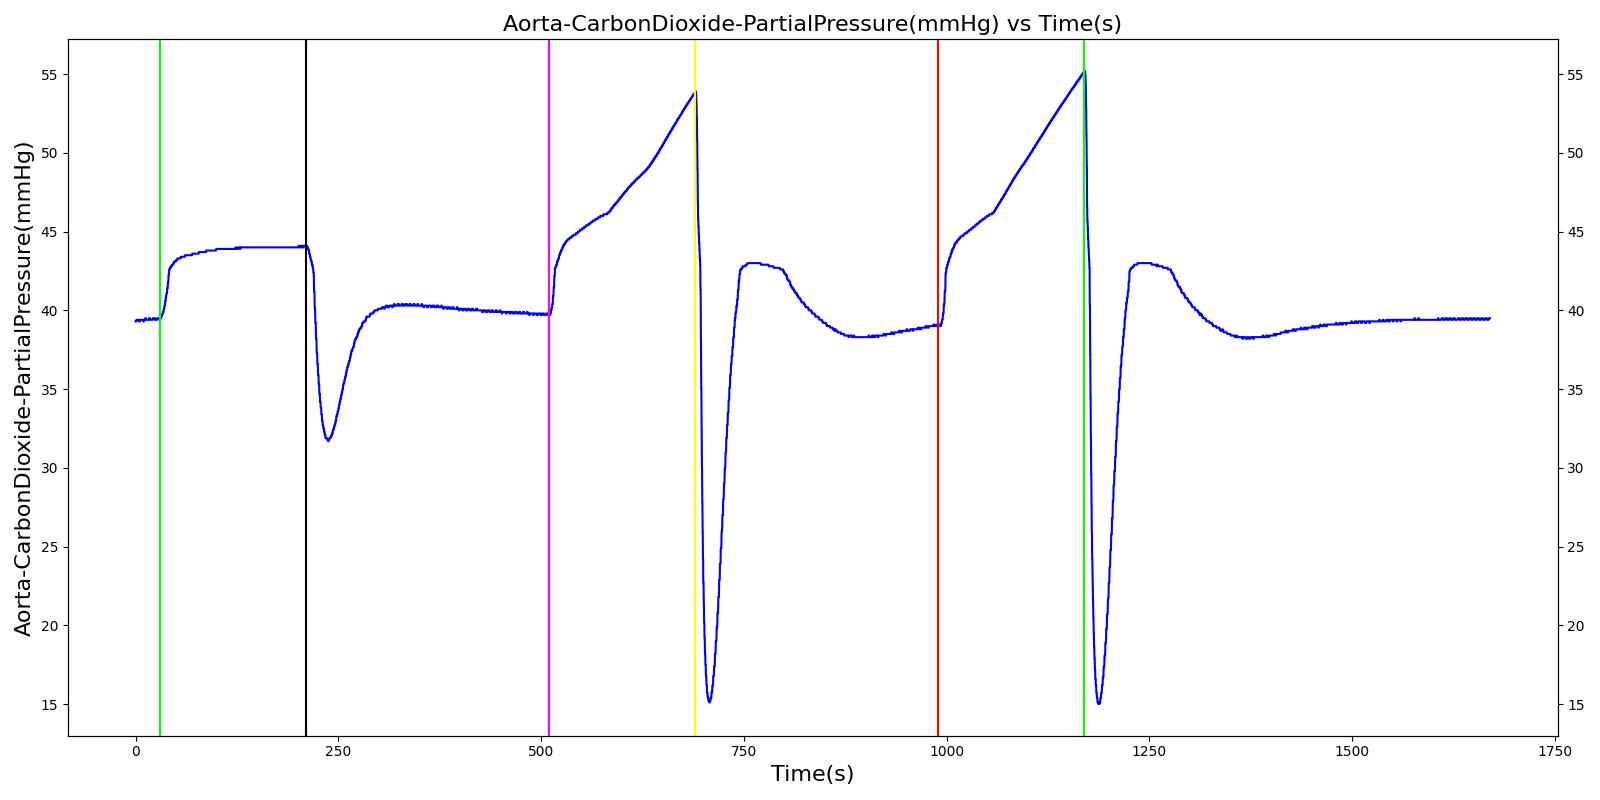 |
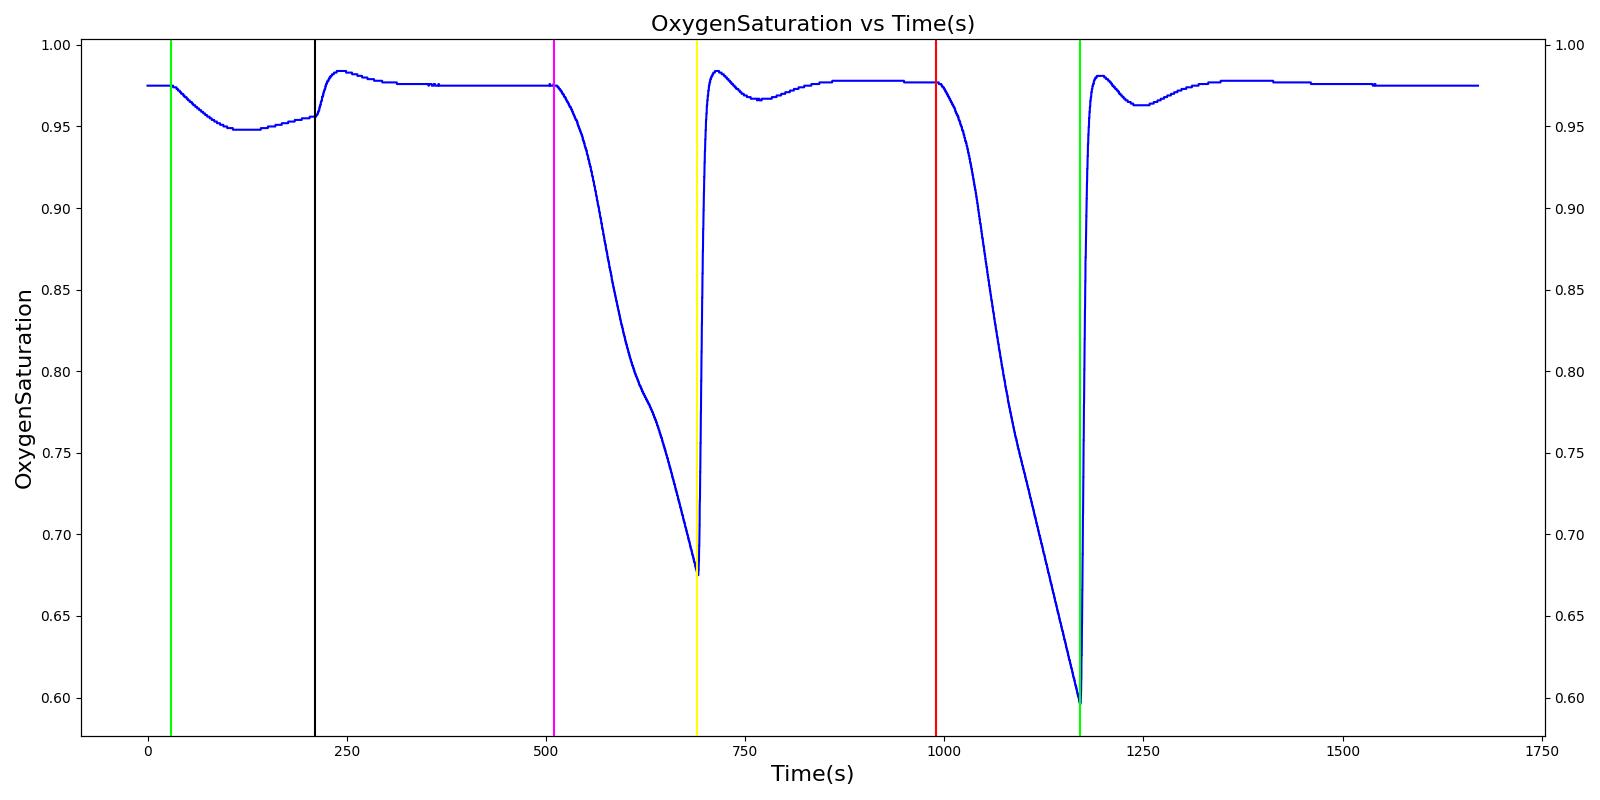 |
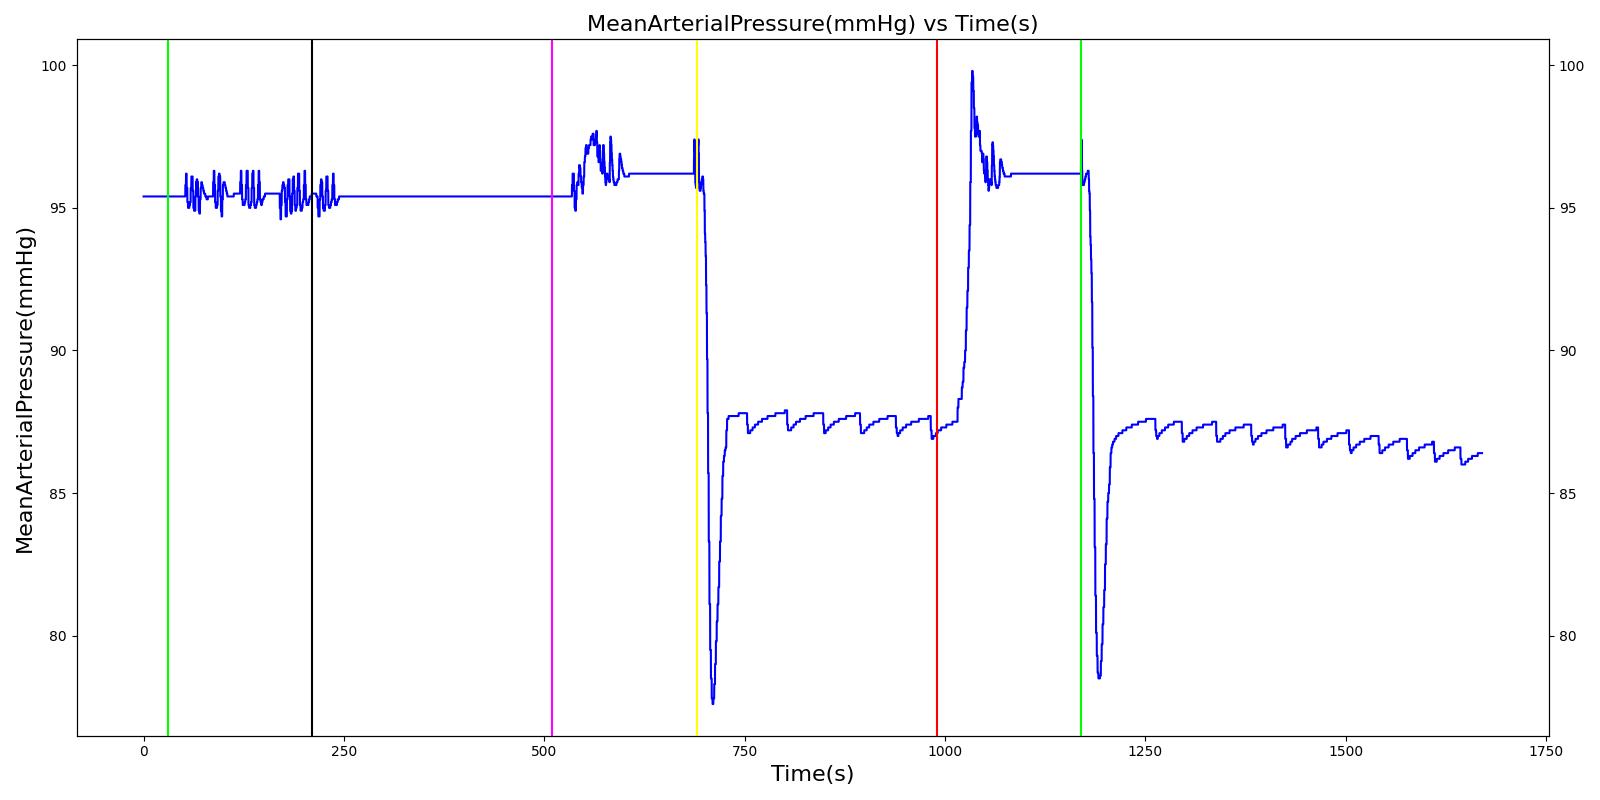 |
 |
|
| Segment | Notes | Action Occurrence Time (s) | Sampled Scenario Time (s) | Respiration Rate (breaths/min) | Heart Rate (beats/min) | Systolic Pressure (mmHg) | Diastolic Pressure (mmHg) | Oxygen Saturation |
|---|---|---|---|---|---|---|---|---|
| Trigger airway obstruction; severity = 0.3 | Represents the partial (severity = 0.3) obstruction of airway due to foreign body (obstructing material). Not severe enough to trigger CV responses. | 30 | 180 | Increase [126] | Increase [226] | Increase [226](case study of awake patient [172]) | Increase [226] (case study of awake patient [172]) | Decrease [126] |
| Remove airway obstruction | Airway obstruction is turned off. | 210 | 300 | returns to resting physiology | returns to resting physiology | returns to resting physiology | returns to resting physiology | returns to resting physiology |
| Turn on airway obstruction; severity = 0.6 | Represents the partial obstruction (severity = 0.6) of airway due to foreign body. | 510 | 180 | Increase > Severity 0.3 [126] | Increase [226] | Increase [226] (case study of awake patient [172]) | Increase [226] (case study of awake patient [172]) | Decrease < Severity 0.3 [126] |
| Remove airway obstruction | Airway obstruction is turned off. | 690 | 300 | returns to resting physiology | returns to resting physiology | returns to resting physiology | returns to resting physiology | returns to resting physiology |
| Turn on airway obstruction; severity = 1.0 | Represents the complete obstruction (severity = 1.0) of airway due to foreign body. | 990 | 180 | Increase > Severity 0.6 [126] | Increase [226] | Increase [226] (case study of awake patient [172]) | Increase [226] (case study of awake patient [172]) | Decrease < Severity 0.6 [126] |
| Remove airway obstruction | Airway obstruction is turned off. | 1170 | 500 | returns to resting physiology | returns to resting physiology | returns to resting physiology | returns to resting physiology | returns to resting physiology |
Bronchoconstriction
The bronchoconstriction action was validated with a scenario that applies varying severities of 0.3, 0.6, and 1.0 to the patient. Varying the severity of the obstruction simulates the constriction of the bronchii, leading to obstructed air flow. The severity levels logarithmically increase the airway resistance.
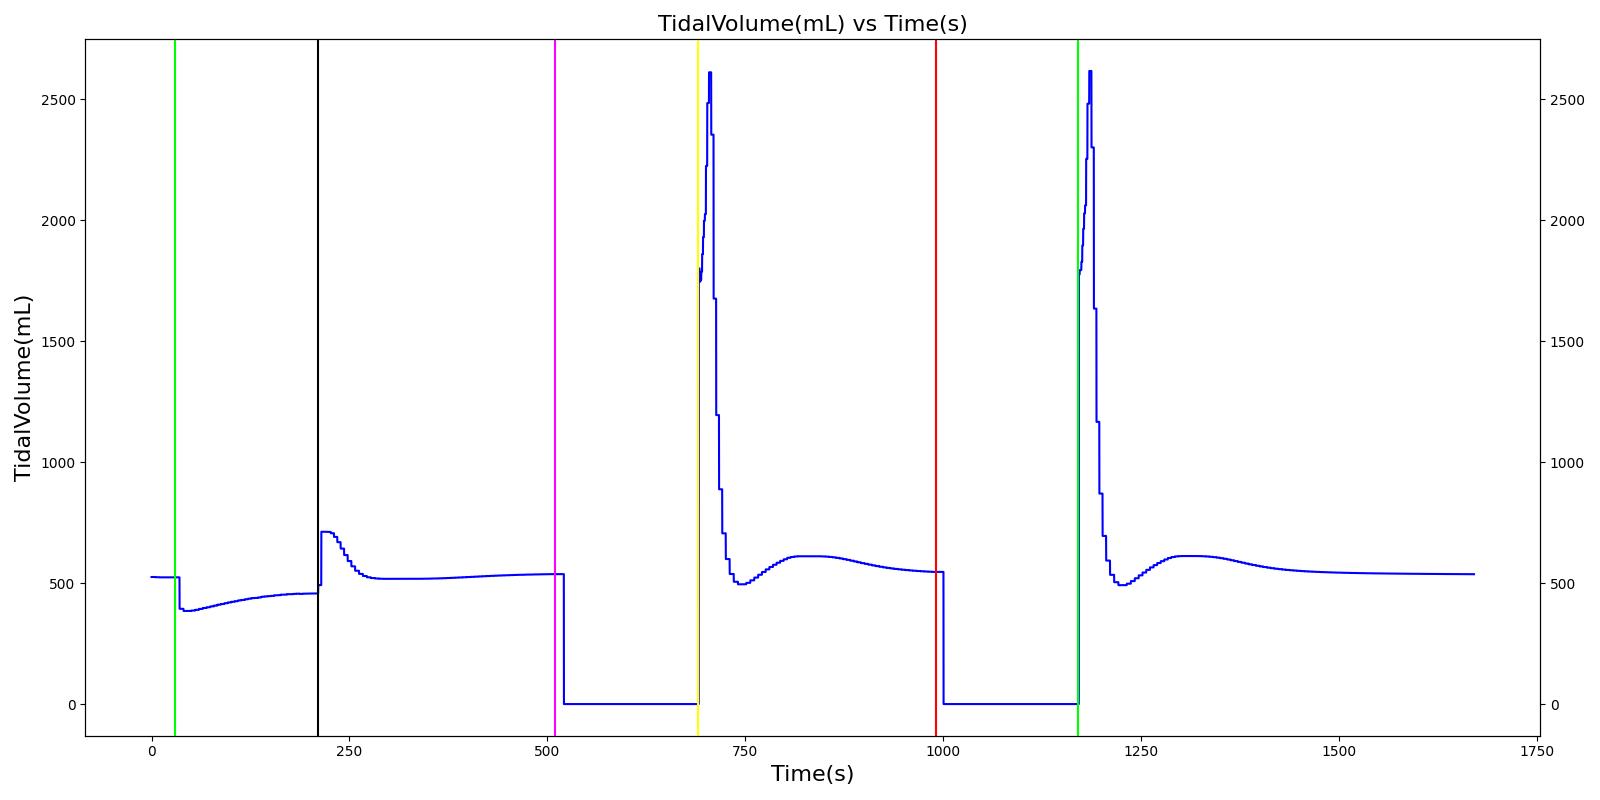 |
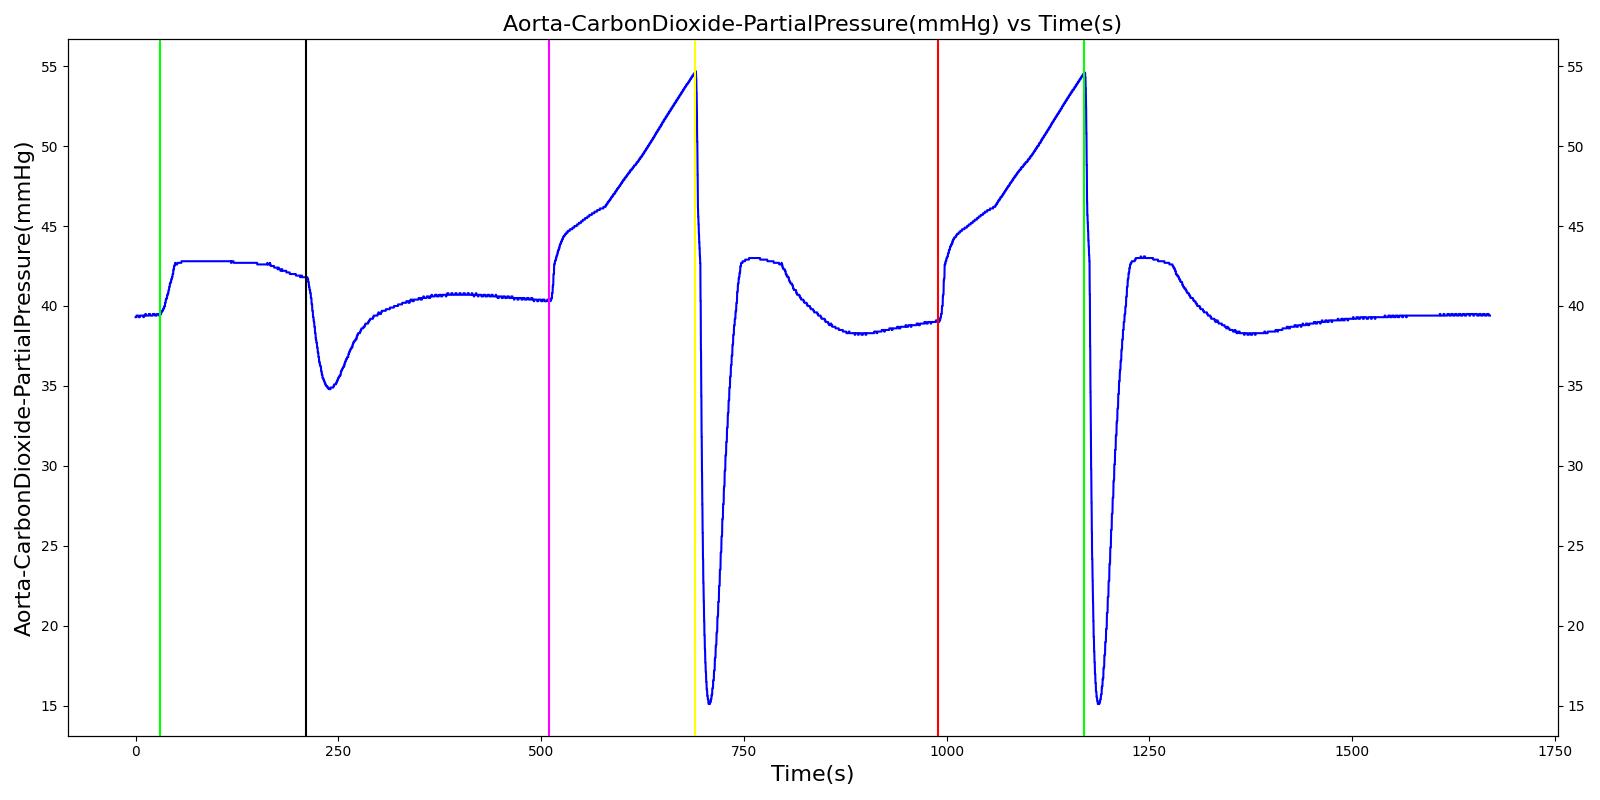 |
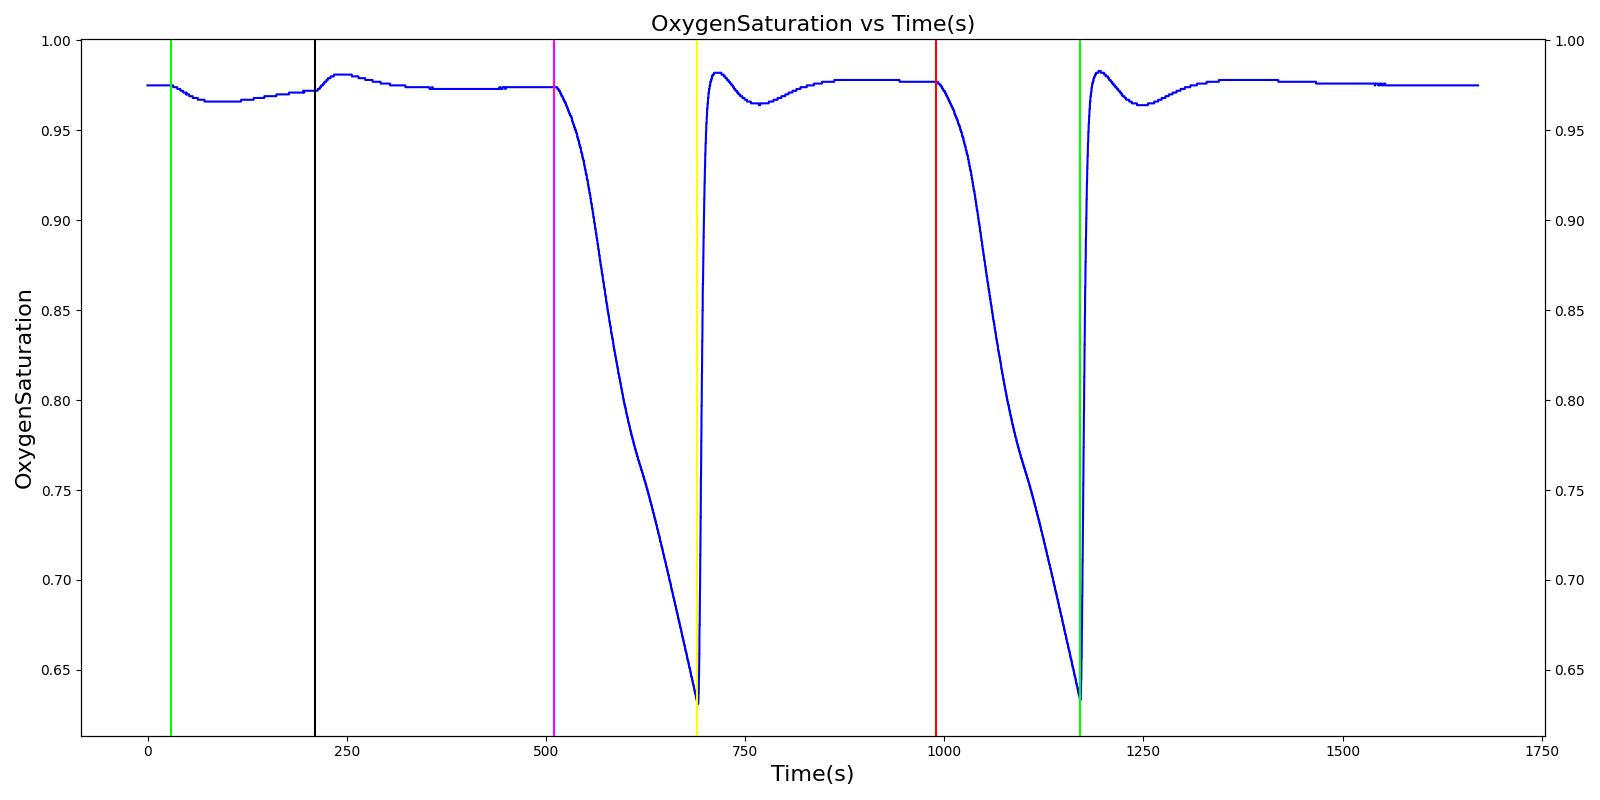 |
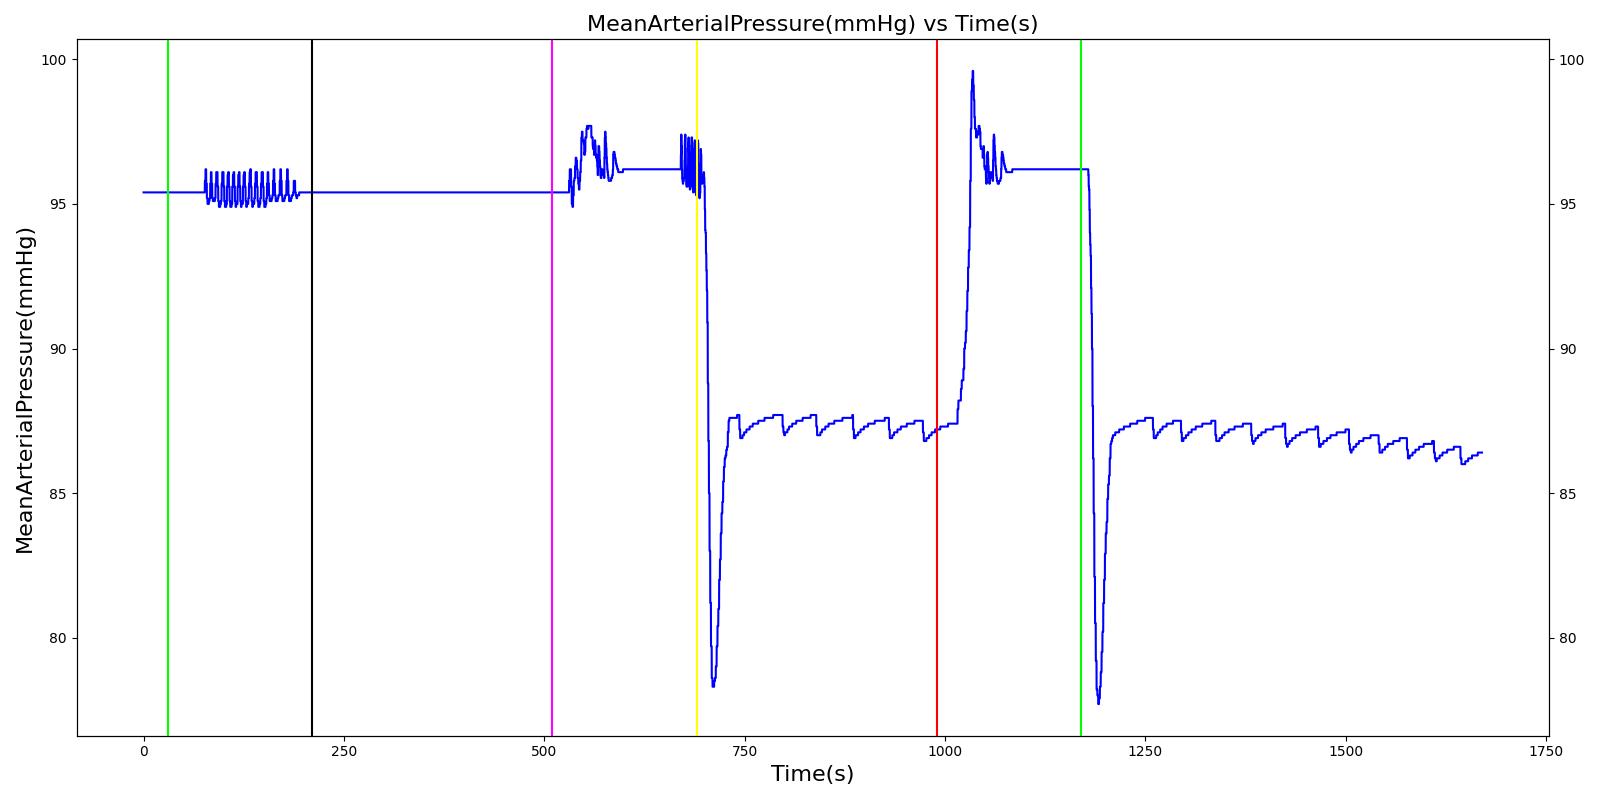 |
 |
|
| Segment | Notes | Action Occurrence Time (s) | Sampled Scenario Time (s) | Respiration Rate (breaths/min) | Heart Rate (beats/min) | Systolic Pressure (mmHg) | Diastolic Pressure (mmHg) | Oxygen Saturation |
|---|---|---|---|---|---|---|---|---|
| Trigger Bronchoconstriction; severity 0.3 | Trigger bronchoconstriction of severity 0.3 by Increasing effective breathing resistances on bronchi. Not severe enough to trigger CV responses. | 30 | 180 | Decrease [126] | Increase tachycardia [114], [126] | Decrease hypotension [114] | Decrease hypotension [114] | Decrease [126] |
| Remove bronchoconstriction | Bronchoconstriction is turned off. | 210 | 300 | returns to resting physiology | returns to resting physiology | returns to resting physiology | returns to resting physiology | returns to resting physiology |
| Trigger Bronchoconstriction; severity = 0.6 | Trigger bronchoconstriction of severity 0.6 by Increasing effective breathing resistances on bronchi. | 510 | 180 | Increase > Severity 0.3 [126] | Increase tachycardia [114], [126] | Decrease hypotension [114] | Decrease hypotension [114] | Decrease < Severity 0.3 [126] |
| Remove bronchoconstriction | Bronchoconstriction is turned off. | 690 | 300 | returns to resting physiology | returns to resting physiology | returns to resting physiology | returns to resting physiology | returns to resting physiology |
| Trigger Bronchoconstriction; severity = 1.0 | Trigger bronchoconstriction of severity 1.0 by Increasing effective breathing resistances on bronchi. | 990 | 180 | Increase > Severity 0.6 [126] | Increase tachycardia [114], [126] | Decrease hypotension [114] | Decrease hypotension [114] | Decrease < Severity 0.6 [126] |
| Remove bronchoconstriction | Bronchoconstriction is turned off. | 1170 | 500 | returns to resting physiology | returns to resting physiology | returns to resting physiology | returns to resting physiology | returns to resting physiology |
Pneumothorax
Two scenarios were used to validate tension pneuomthorax and its associated interventions, occlusive dressing, and needle decompression. Table 14 demonstrates the open tension pneumothorax on the left side of the chest at increasing severities treated with an occlusive dressing and needle decompression. The engine output for relevant parameters was compared to the validation data. The blood pressures (systolic, diastolic, and mean arterial pressure) shows hypotension during the open wound pneumothorax incidences on a single lung due to the mediastinum shift. Other respiratory and cardiovascular outputs show good agreement with published data. Vital signs become more dire the longer the pneumothorax is applied without intervention and as the severity (i.e. hole size) is increased. Evidence suggests that patients have progressive respiratory deterioration with final respiratory arrest [206]. However, the current model does not include a definition for respiratory arrest and will continue to run until another irreversible state is reached. After an occlusive dressing is added to seal the hole and needle decompression is applied, the patient's condition improves and vitals begin returning toward normal. This is as expected compared to the validation data.
It is important to note nervous system responses of a conscious patient due to pain or panicking are not included with the Pneumothorax action. Some of these responses can be attained by including an Acute Stress action (see Endocrine Methodology).
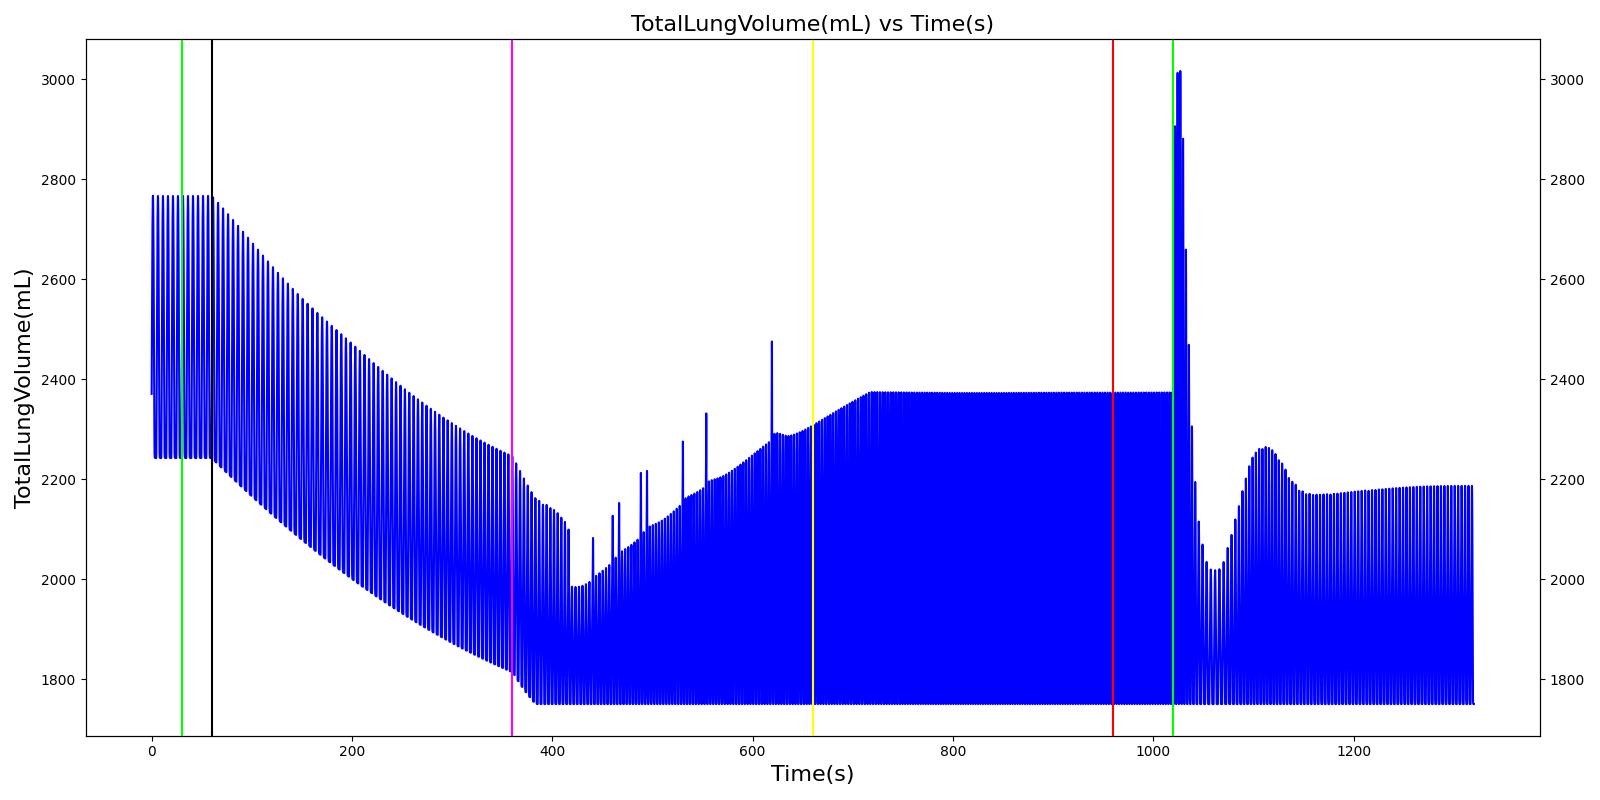 |
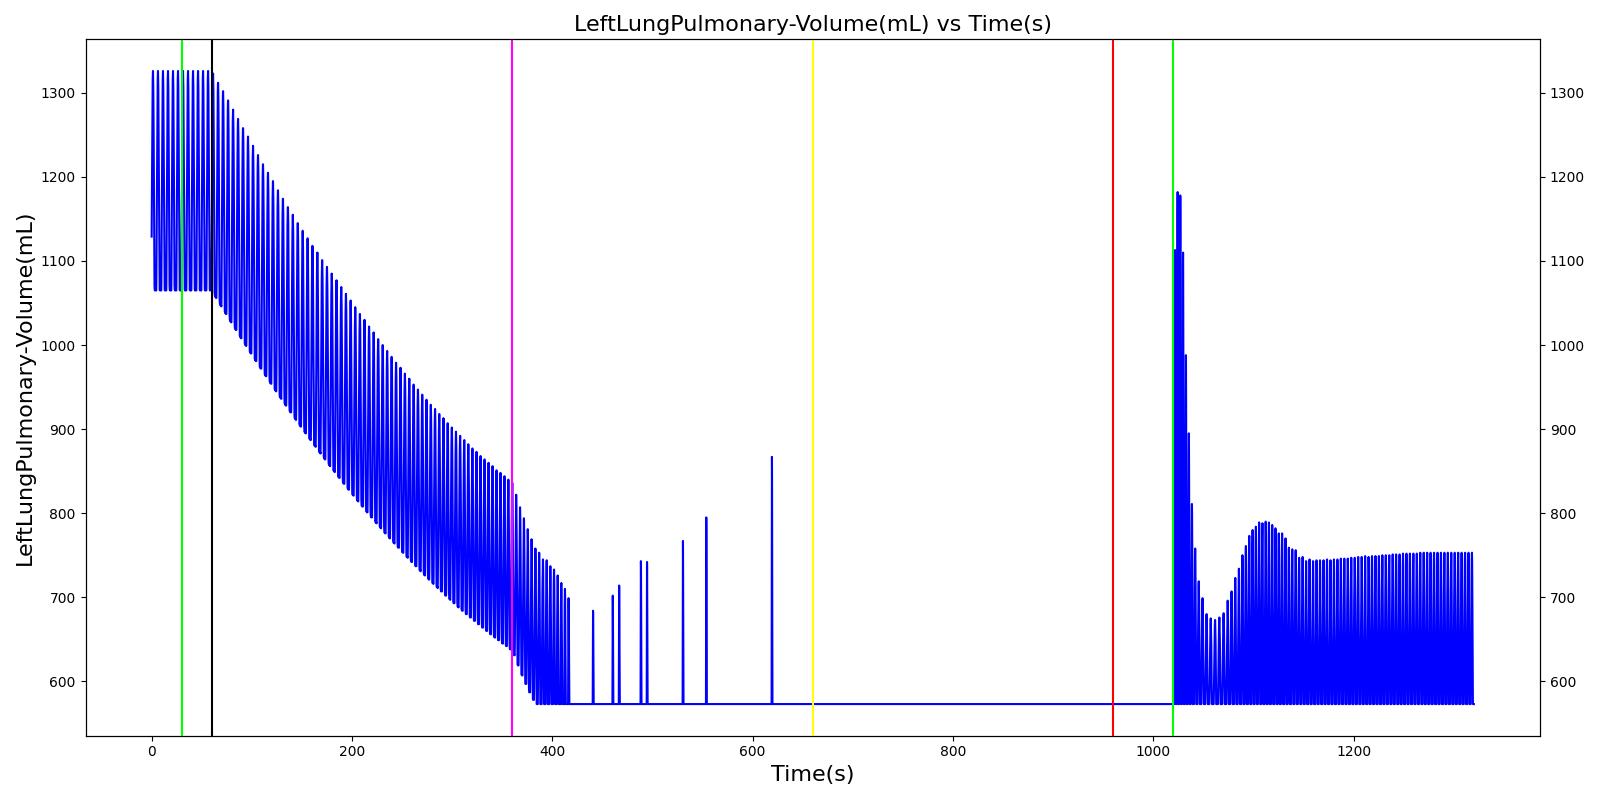 |
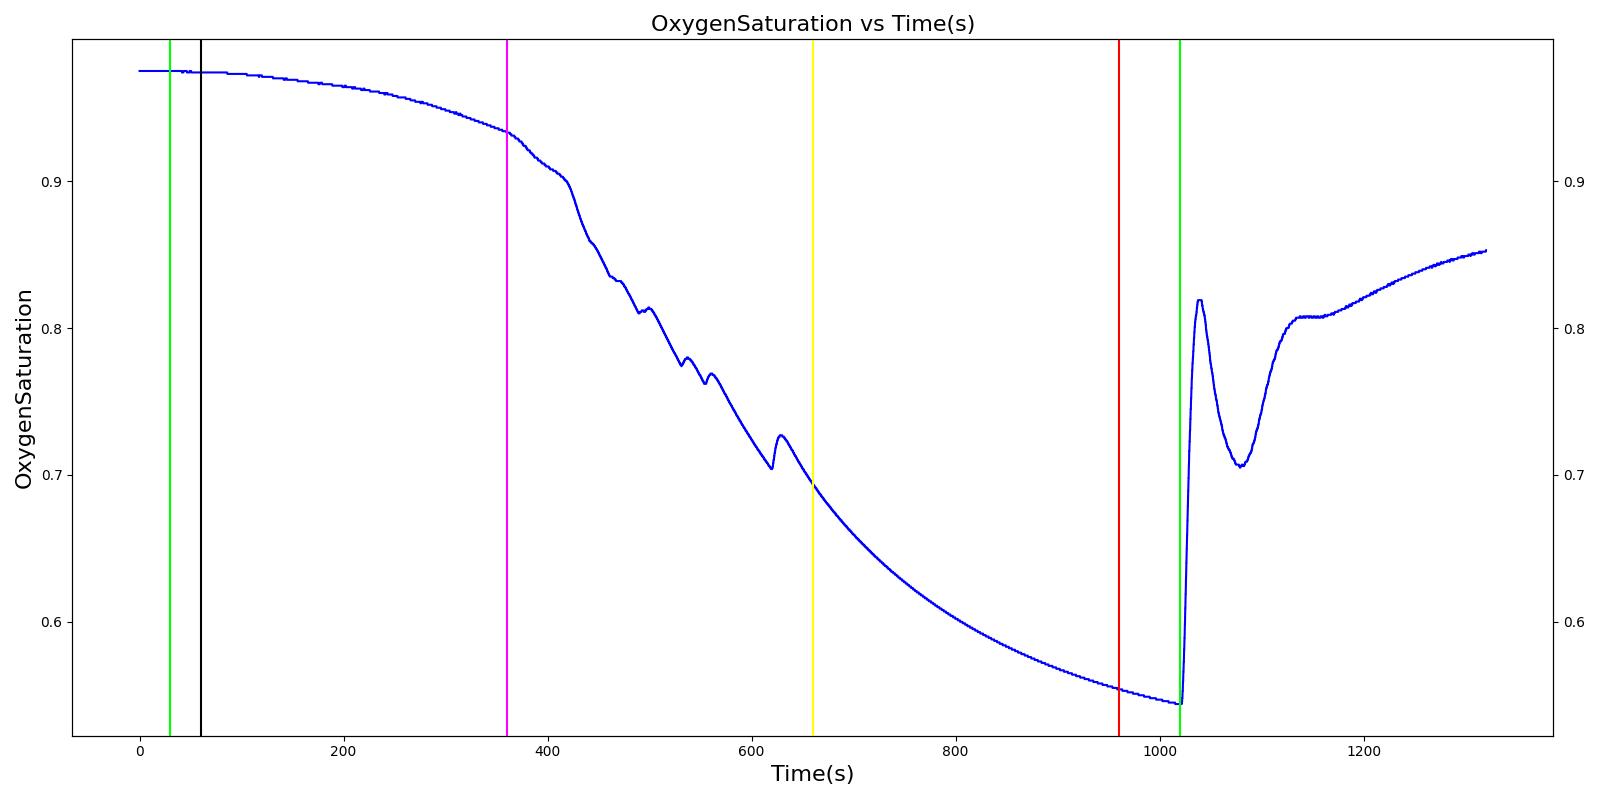 |
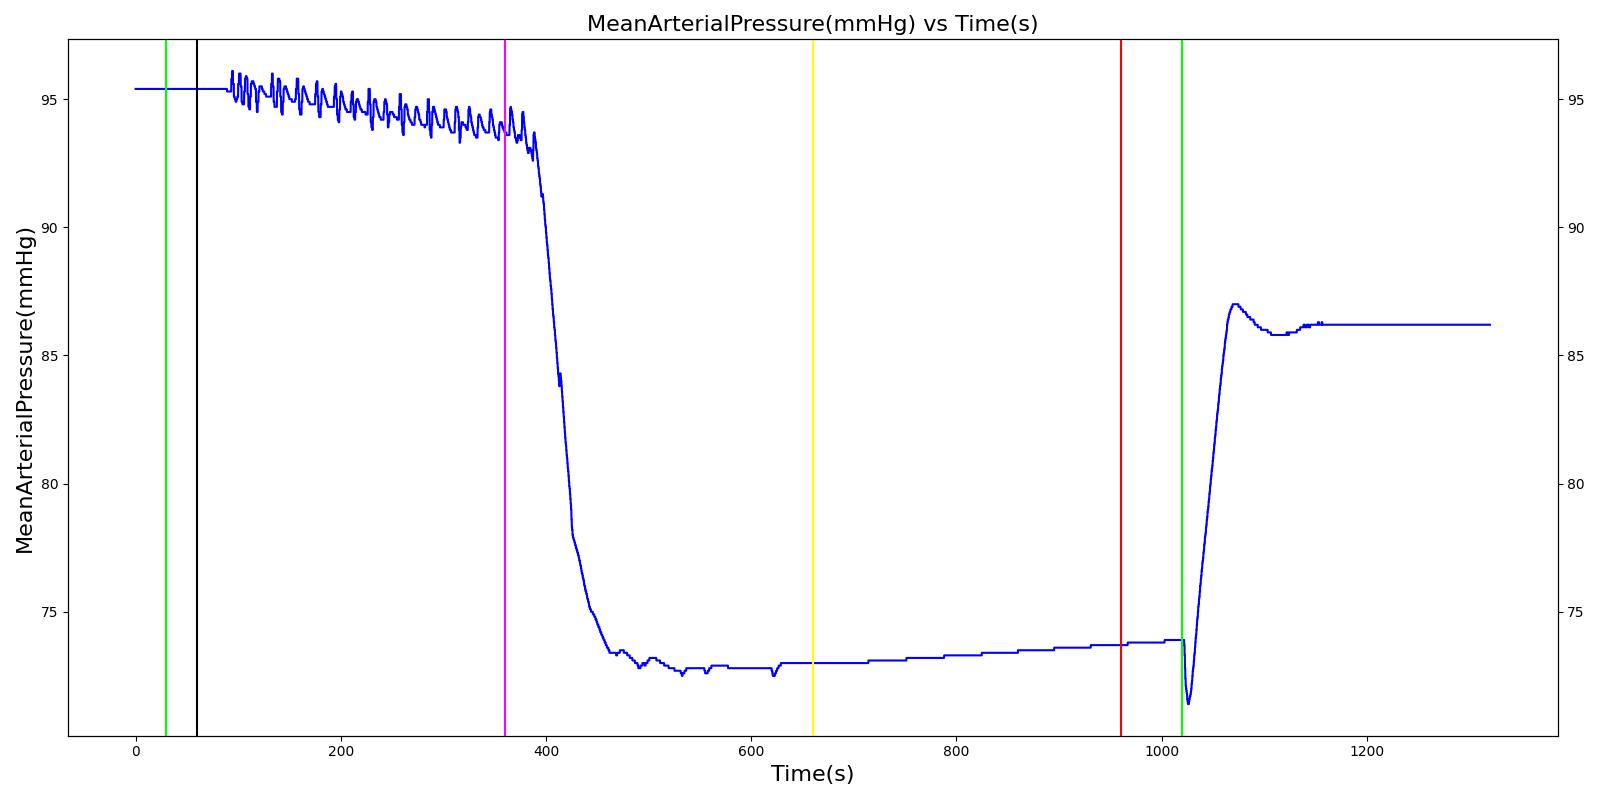 |
 |
|
| Segment | Notes | Action Occurrence Time (s) | Sampled Scenario Time (s) | Respiration Rate (breaths/min) | Tidal Volume (mL) | Heart Rate (beats/min) | Systolic Pressure (mmHg) | Diastolic Pressure (mmHg) | Mean Arterial Pressure (mmHg) | Oxygen Saturation | End Tidal CO2 (mmHg) |
|---|---|---|---|---|---|---|---|---|---|---|---|
| Tension Pneumothorax; Open, severity = 0.0 | A severity of zero should not change the leak resistance from the default open switch value. | 0 | 15 | No Change | No Change | No Change | No Change | No Change | No Change | No Change | No Change |
| Tension Pneumothorax; Open, severity = 0.3 | Represents a "sucking" chest wound on the left lung side with a mild severity (medium size hole). | 30 | 300 | No change or Increase [39], [206] | Increase [39], [206] | No change or Increase [39], [206] | No change or Decrease [39], [206] | No change or Decrease [39], [206] | No change or Decrease [39], [206] | No change or Decrease [39], [206] | Modest increase, then decrease as it evolves [338] |
| Tension Pneumothorax; Open, severity = 0.6 | Represents a "sucking" chest wound on the left lung side with a moderate severity (large size hole). | 360 | 600 | Increase [39], [206] | Increase [206] | Increase [39], [206] | Decrease [39], [206] | Decrease [39], [206] | Decrease [39], [206] | Decrease [39], [206] | Decrease < 35 [338] |
| Tension Pneumothorax; Open, severity = 1.0 | Represents a "sucking" chest wound on the left lung side with the severe severity (maximum size hole). Should lead to full collapse. | 660 | 900 | Clinical sign: Tachypnea [39], [206] | Increase [206] | Clinical sign: Tachycardia [39], [206] | Clinical sign: Hypotension [39], [206] | Clinical sign: Hypotension [39], [206] | Clinical sign: Hypotension [39], [206] | Clinical sign: Hypoxia [39], [206] | Decrease < 35 [338] |
| Apply Chest Occlusive dressing on the left side | Represents the closing of chest wound on the left side | 960 | 1000 | No Change or Increased [226] | No Change | Tachycardia > 120 [226] | Slightly improved to no change [226] | Slightly improved to no change [226] | Slightly improved to no change [226] | Modest decrease to no change [226] | No Change |
| Apply needle decompression | Needle decompression is applied on the left side of the chest | 1020 | 1320 | Returning toward normal [226] | Returning toward normal [226] | Returning toward normal [226] | Slightly diminished from normal [226] | Slightly diminished from normal [226] | Slightly diminished from normal [226] | Normal [226] | Rapidly increase [338] |
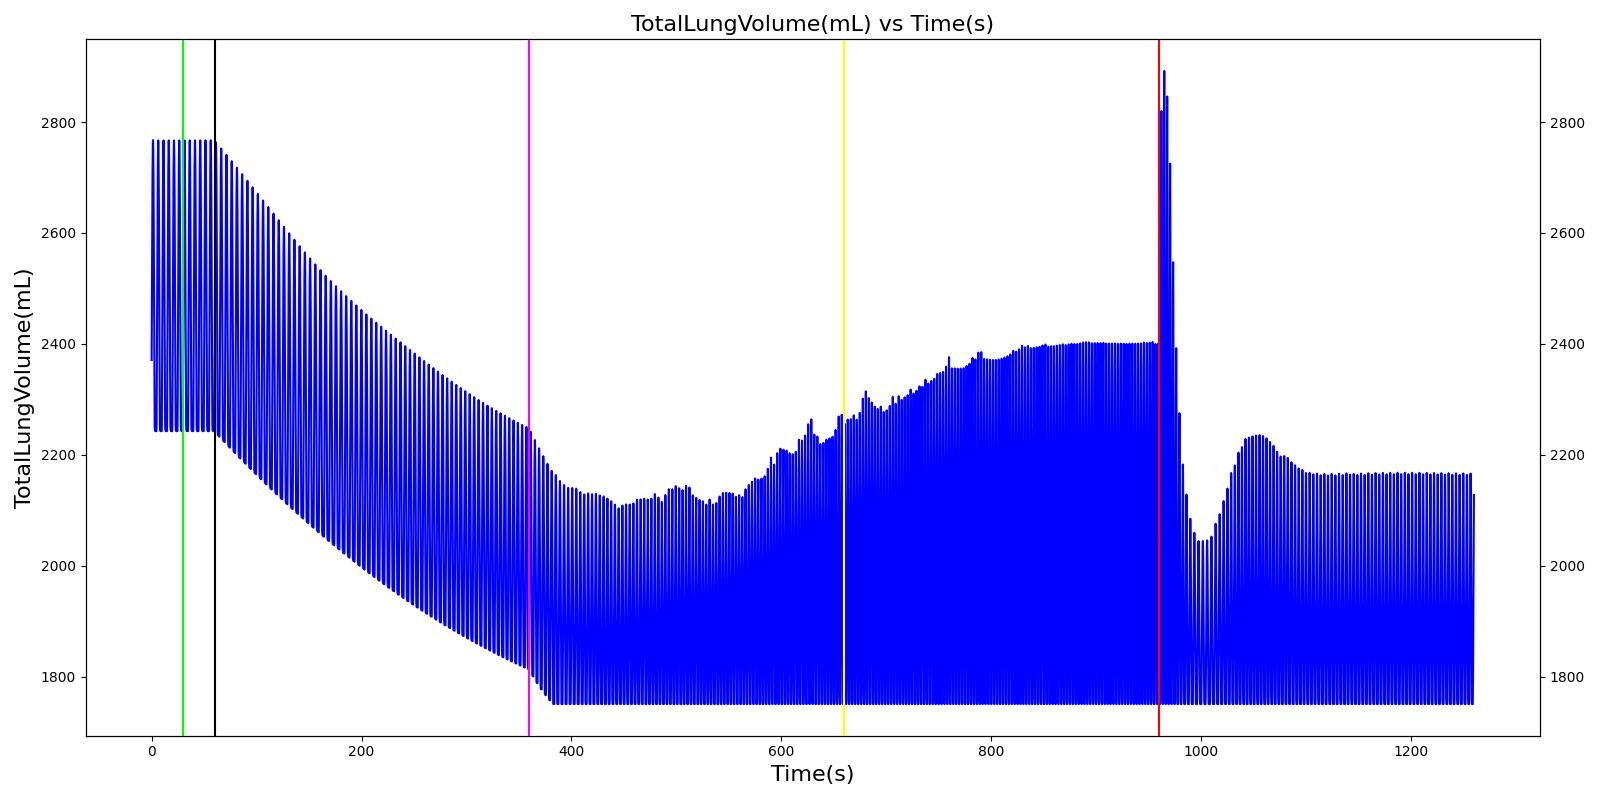 |
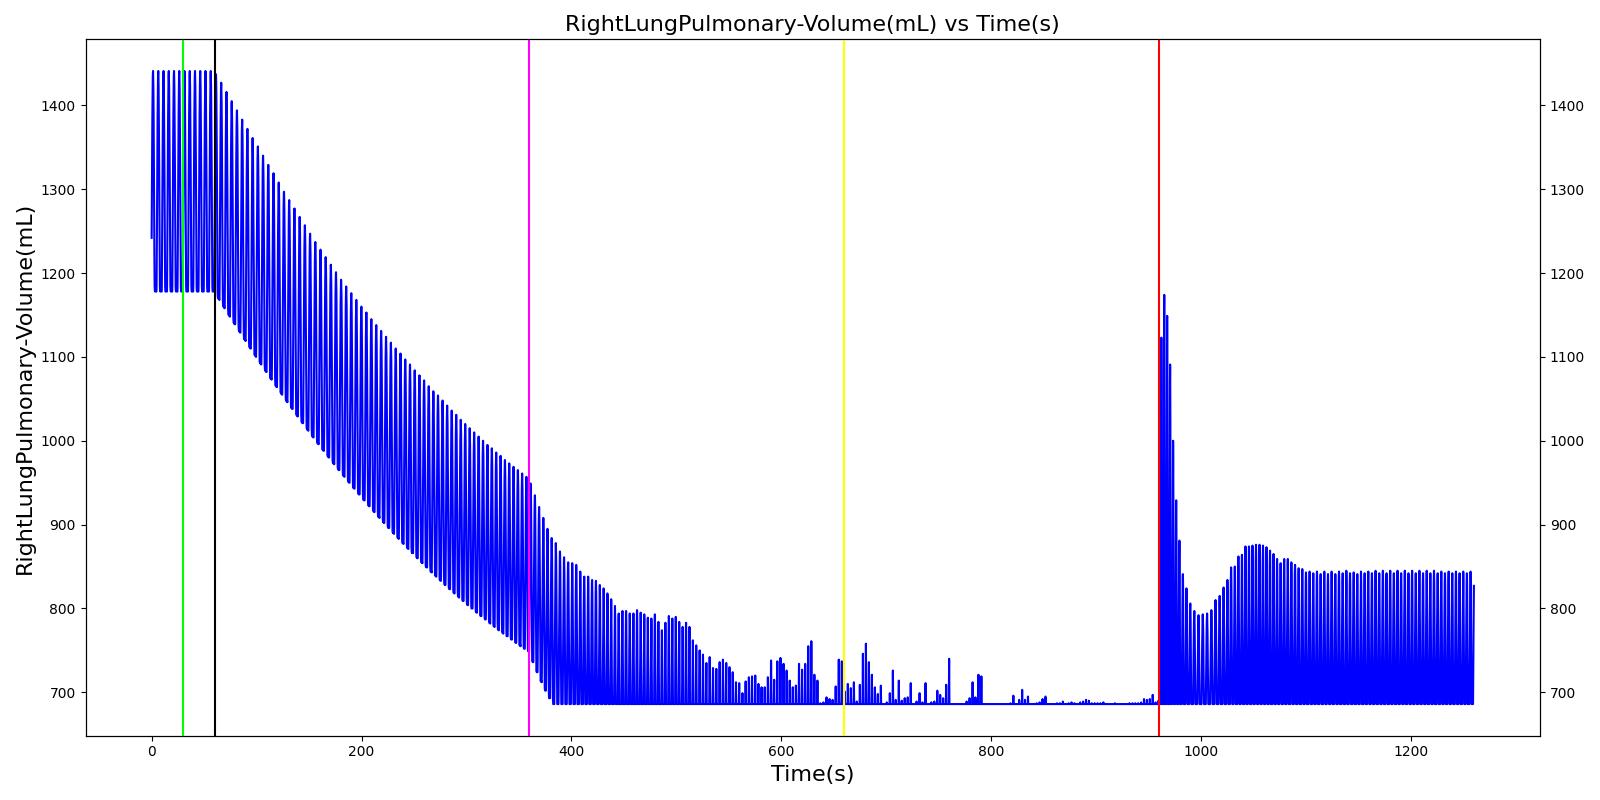 |
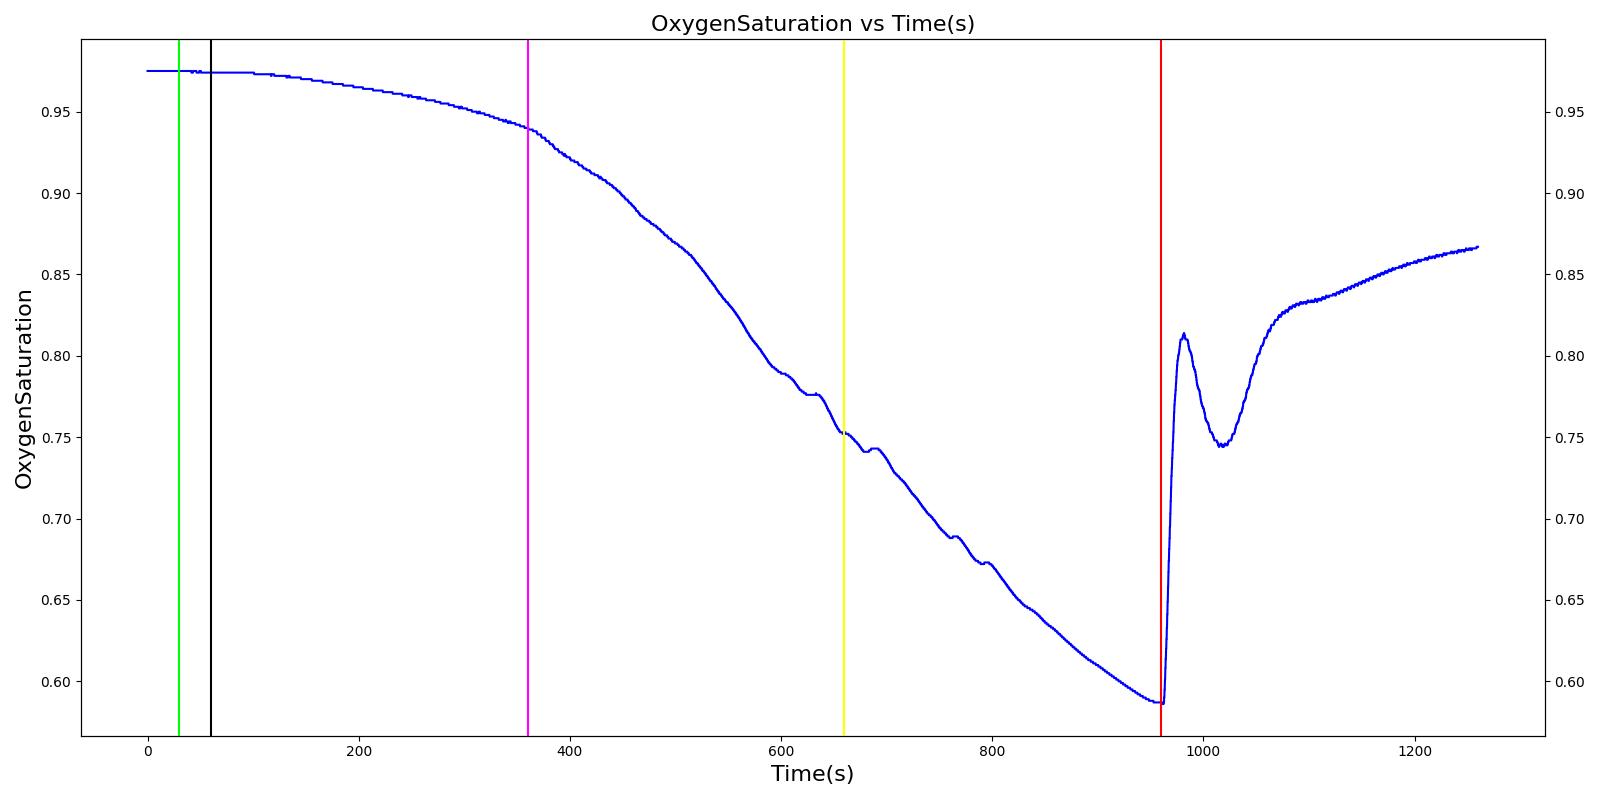 |
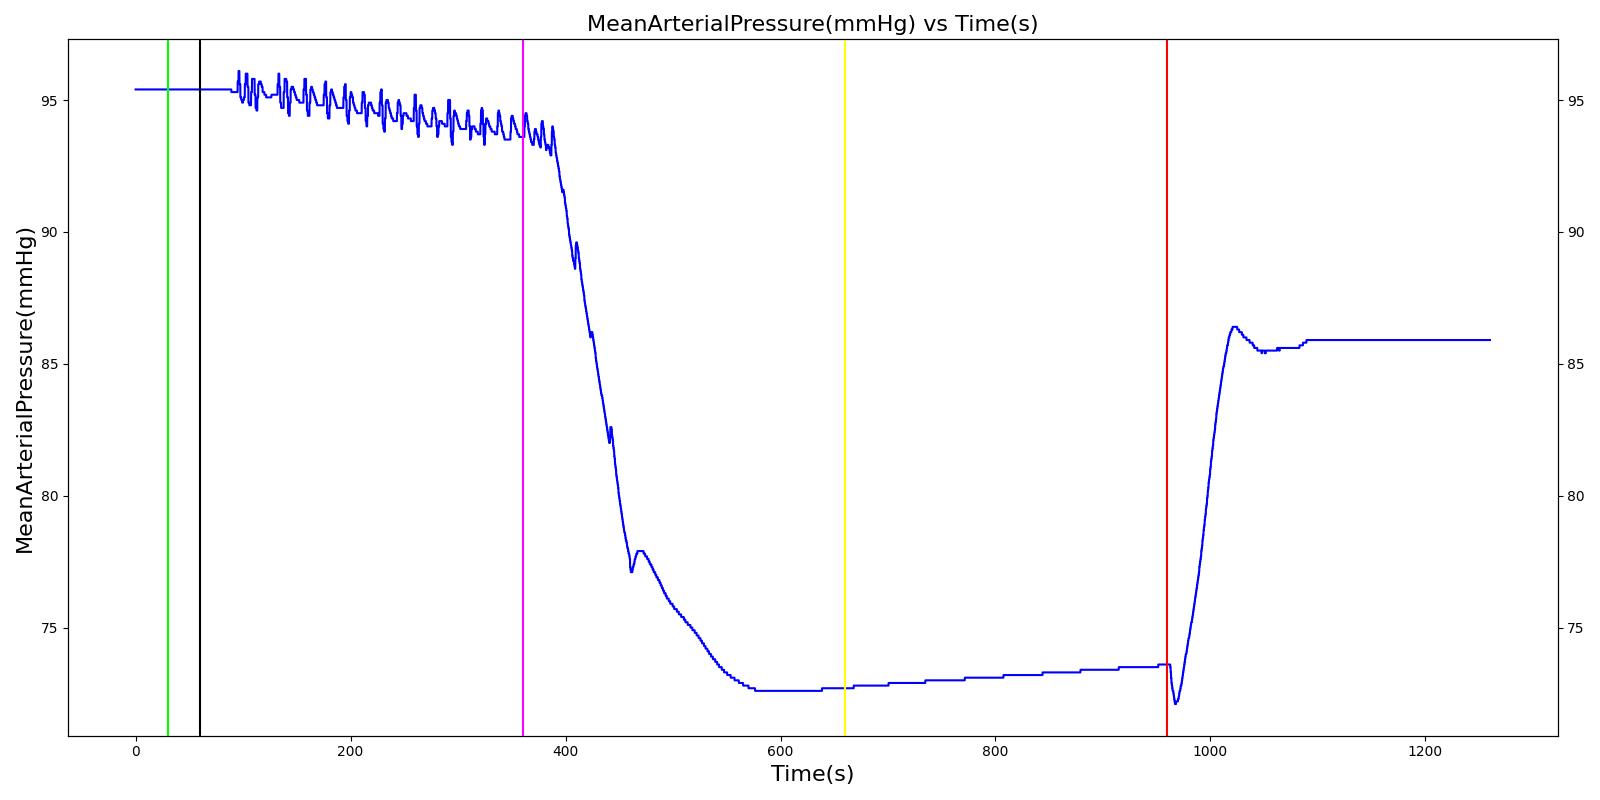 |
 |
|
| Segment | Notes | Action Occurance Time (s) | Sampled Scenario Time (s) | Respiration Rate (breaths/min) | Tidal Volume (mL) | Heart Rate (beats/min) | Systolic Pressure (mmHg) | Diastolic Pressure (mmHg) | Mean Arterial Pressure (mmHg) | Oxygen Saturation | Oxygen Saturation |
|---|---|---|---|---|---|---|---|---|---|---|---|
| Tension Pneumothorax; Closed, severity = 0.0 | A severity of zero should not change the leak resistance from the defualt open switch value. | 0 | 15 | No Change | No Change | No Change | No Change | No Change | No Change | No Change | No Change |
| Tension Pneumothorax; Closed, severity = 0.3 | Represents a leak on the right lung side with a mild severity (medium size hole). | 30 | 300 | No change or Increase [39], [206] | Increase [39], [206] | No change or Increase [39], [206] | No change or Decrease [39], [206] | No change or Decrease [39], [206] | No change or Decrease [39], [206] | No change or Decrease [39], [206] | Modest increase, then decrease as it evolves [338] |
| Tension Pneumothorax; Closed, severity = 0.6 | Represents a leak on the right lung side with a moderate severity (large size hole). | 360 | 600 | Increase [39], [206] | Increase [206] | Increase [39], [206] | Decrease [39], [206] | Decrease [39], [206] | Decrease [39], [206] | Decrease [39], [206] | Decrease < 35 [338] |
| Tension Pneumothorax; Closed, severity = 1.0 | Represents a leak on the right lung side with the severe severity (maximum size hole). Should lead to full collapse. | 660 | 900 | Clinical sign: Tachypnea [39], [206] | Increase [206] | Clinical sign: Tachycardia [39], [206] | Clinical sign: Hypotension [39], [206] | Clinical sign: Hypotension [39], [206] | Clinical sign: Hypotension [39], [206] | Clinical sign: Hypoxia [39], [206] | Decrease < 35 [338] |
| Apply needle decompression | Needle decompression is applied on the right side of the chest | 960 | 1260 | Slightly lower tachypnea [226] | Returning toward normal [226] | Tachycardia, but may be lower value [226] | Slightly diminished from normal [226] | Slightly diminished from normal [226] | Slightly diminished from normal [226] | Normal [226] | Rapidly increase [338] |
Mainstem Intubation
The right and left mainstem intubation actions were validated with a scenario that simulates mechanical ventilation with improper tracheal tube placement. In this scenario, the patient is injected with succinycholine, then mechanically ventilated through the placement of the endotracheal tube. During the intubation action, the tube is incorrectly placed, leading to the right and left mainstem intubation. The mainstem intubations are then set to the trachea for proper function.
Common clinical vital signs were compared to validation data, as shown in Table 16.
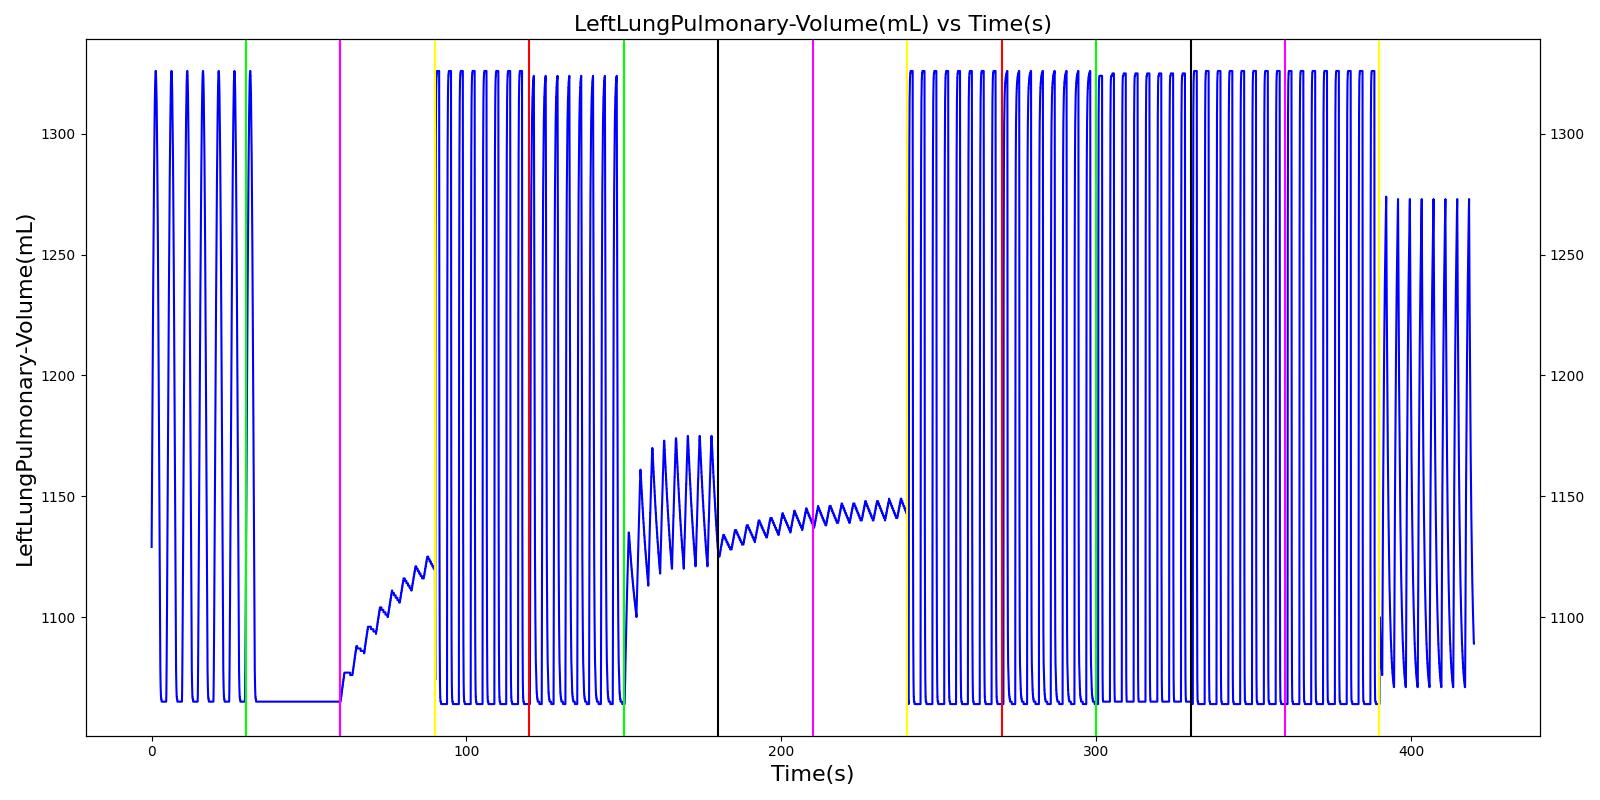 |
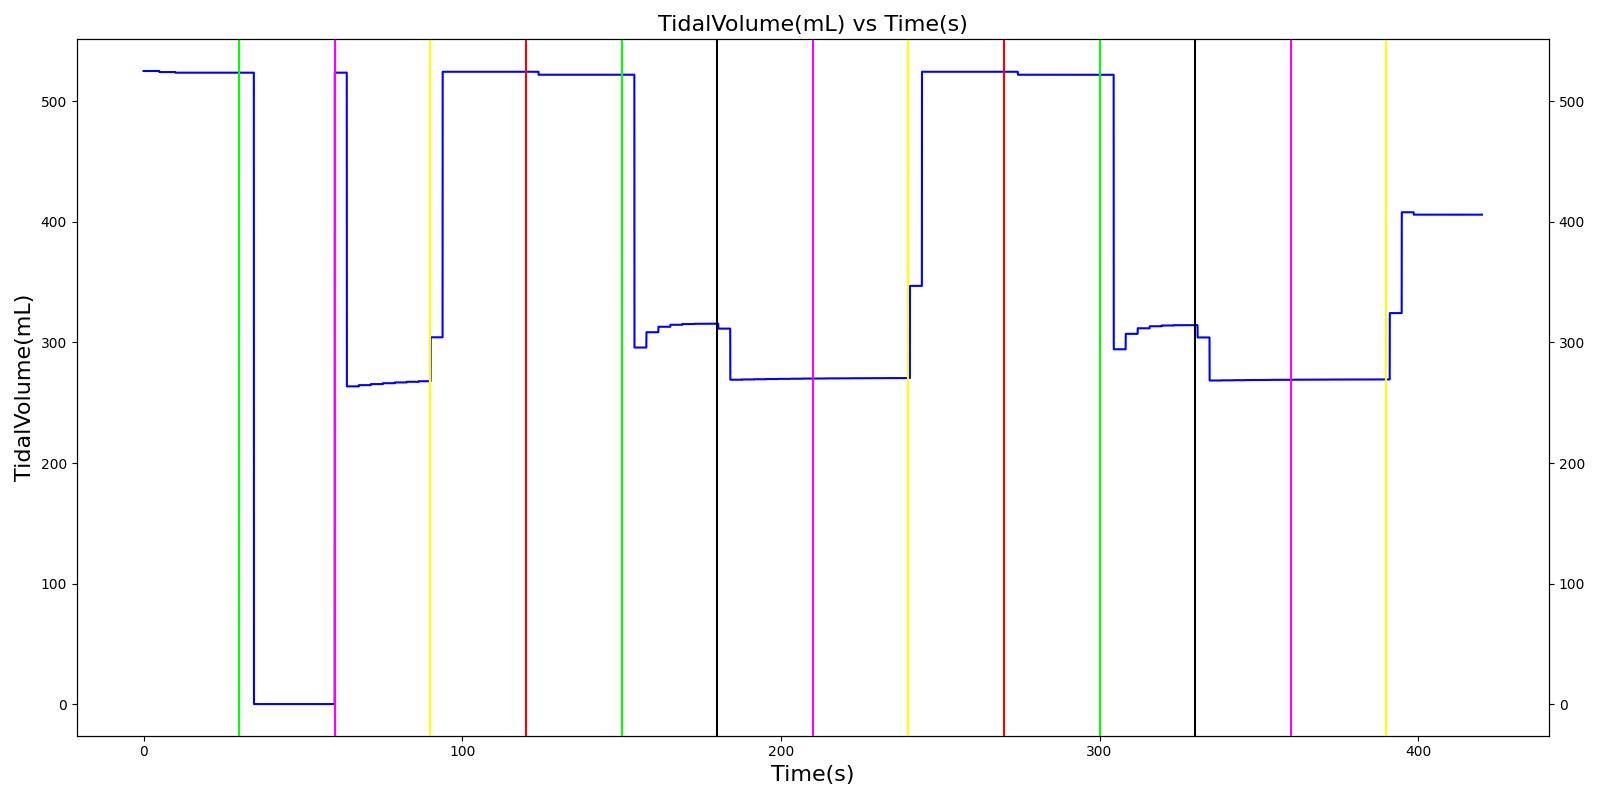 |
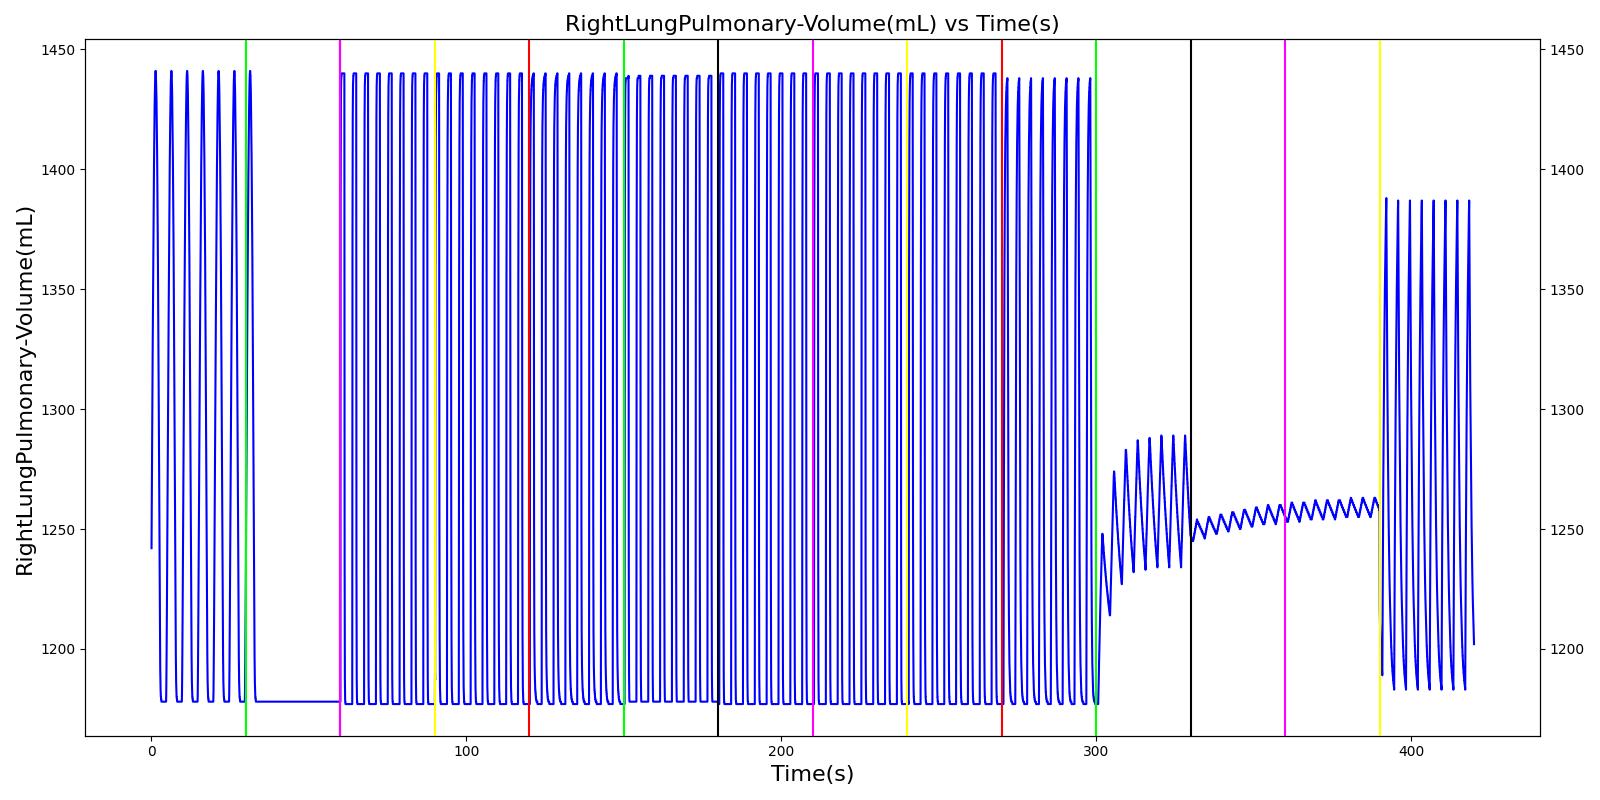 |
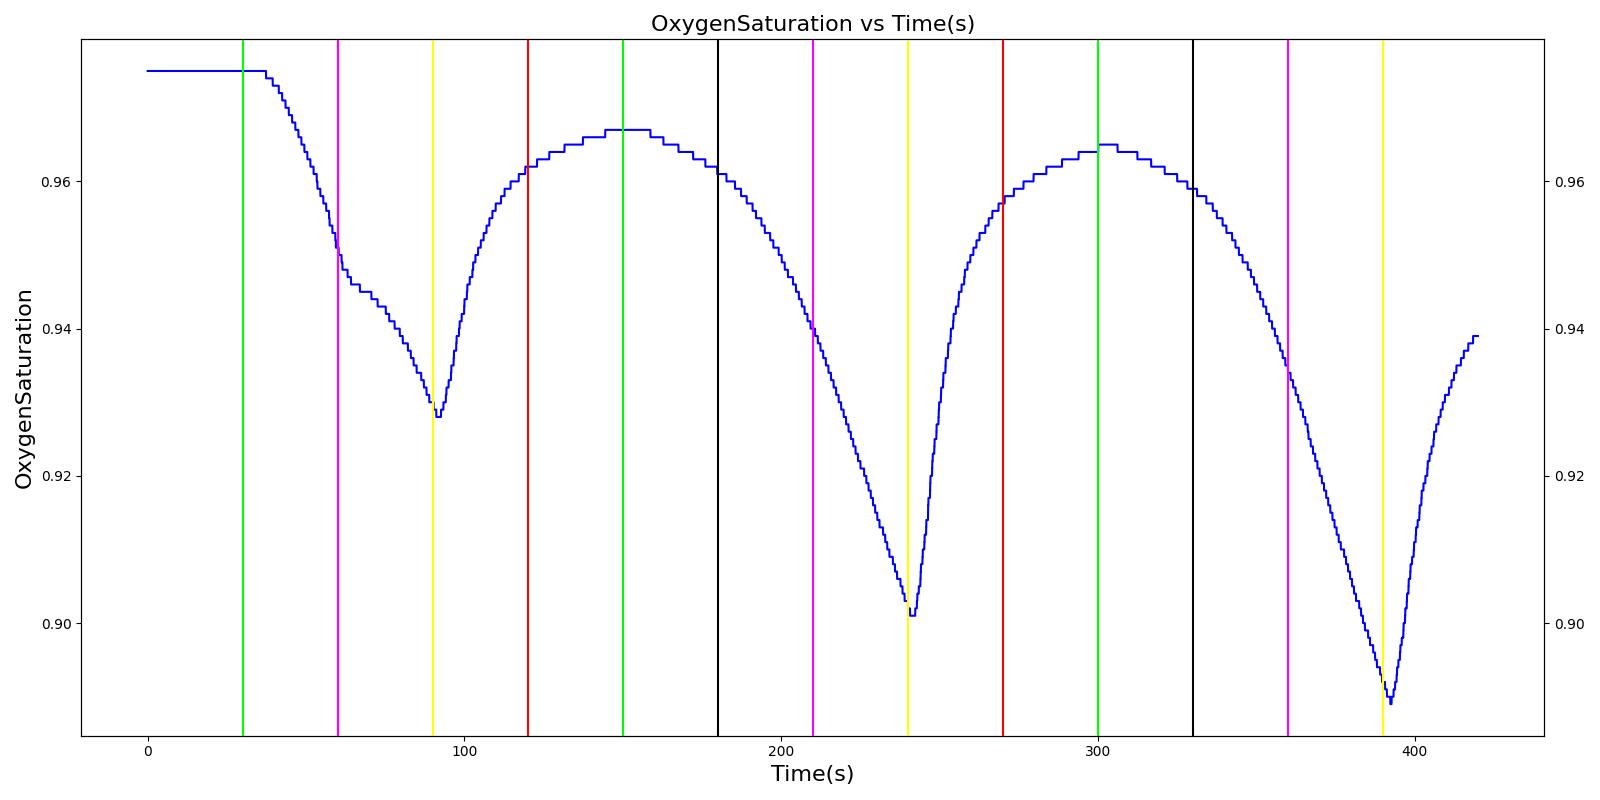 |
 |
|
| Segment | Notes | Action Occurrence Time (s) | Sampled Scenario Time (s) | Respiration Rate (breaths/min) | Heart Rate (beats/min) | Systolic Pressure (mmHg) | Diastolic Pressure (mmHg) | Oxygen Saturation |
|---|---|---|---|---|---|---|---|---|
| Turn on Anesthesia Machine and insert Endotracheal (ET) tube in the right mainstem | Anesthesia machine is turned on to supply oxygen to the subject. ET tube is inserted, but it is set in the right mainstem. | 60 | 180 | 16 (set by machine) | No Change [253]; Increase above normal due to cardiovascular stress [226] | No Change [253]; Increase above normal due to cardiovascular stress [226] | No Change [253]; Increase above normal due to cardiovascular stress [226] | Continues to drop; 93-95% [226] |
| Reset ET tube in the trachea. | ET tube is adjusted to be set in the trachea (good depth). | 180 | 480 | 16 (set by machine) | Towards normal [226] | Towards normal [226] | Towards normal [226] | Towards normal [226] |
| Turn on Anesthesia Machine and insert Endotracheal (ET) tube in the left mainstem | ET tube is adjusted, but it is set in the left mainstem. | 480 | 600 | 16 (set by machine) | No Change [253]; Increase above normal due to cardiovascular stress [226] | No Change [253]; Increase above normal due to cardiovascular stress [226] | No Change [253]; Increase above normal due to cardiovascular stress [226] | Continues to drop; 93-95% [226] |
| Reset ET tube in the trachea. | ET tube is adjusted to be set in the trachea (good depth). | 600 | 900 | 16 (set by machine) | Towards normal [226] | Towards normal [226] | Towards normal [226] | Towards normal [226] |
Esophageal Intubation
The esophageal intubation action was validated with a scenario with multiple intubation attempts, a failed esophageal intubation following by a successful endotracheal intubation. In this scenario, the patient is injected with succinycholine, followed by mechanical ventilation via an endotracheal tube. The first attempt at intubation results in an esophageal intubation. A second attempt is successful.
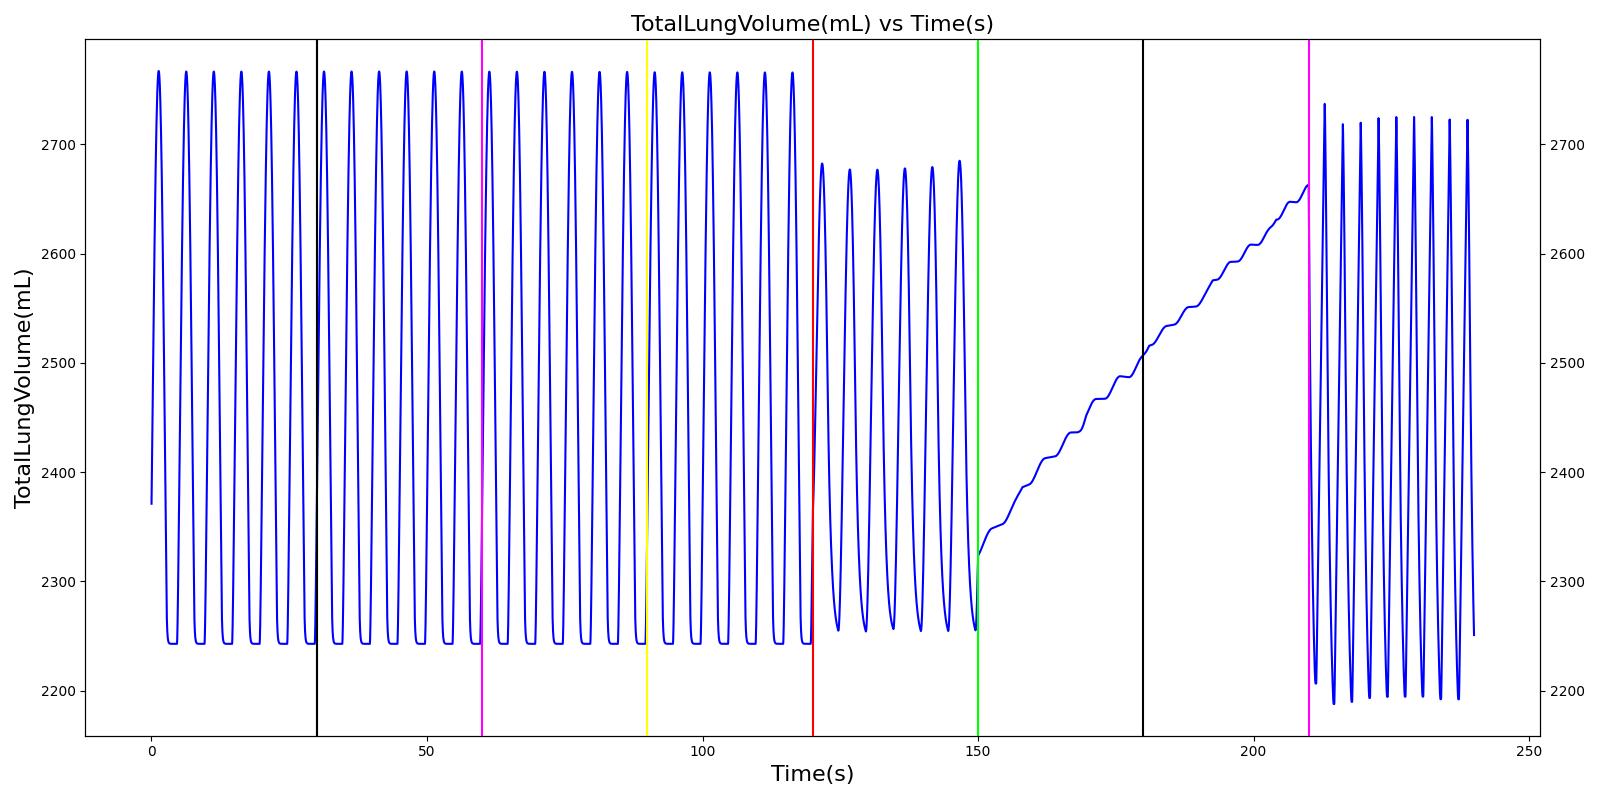 |
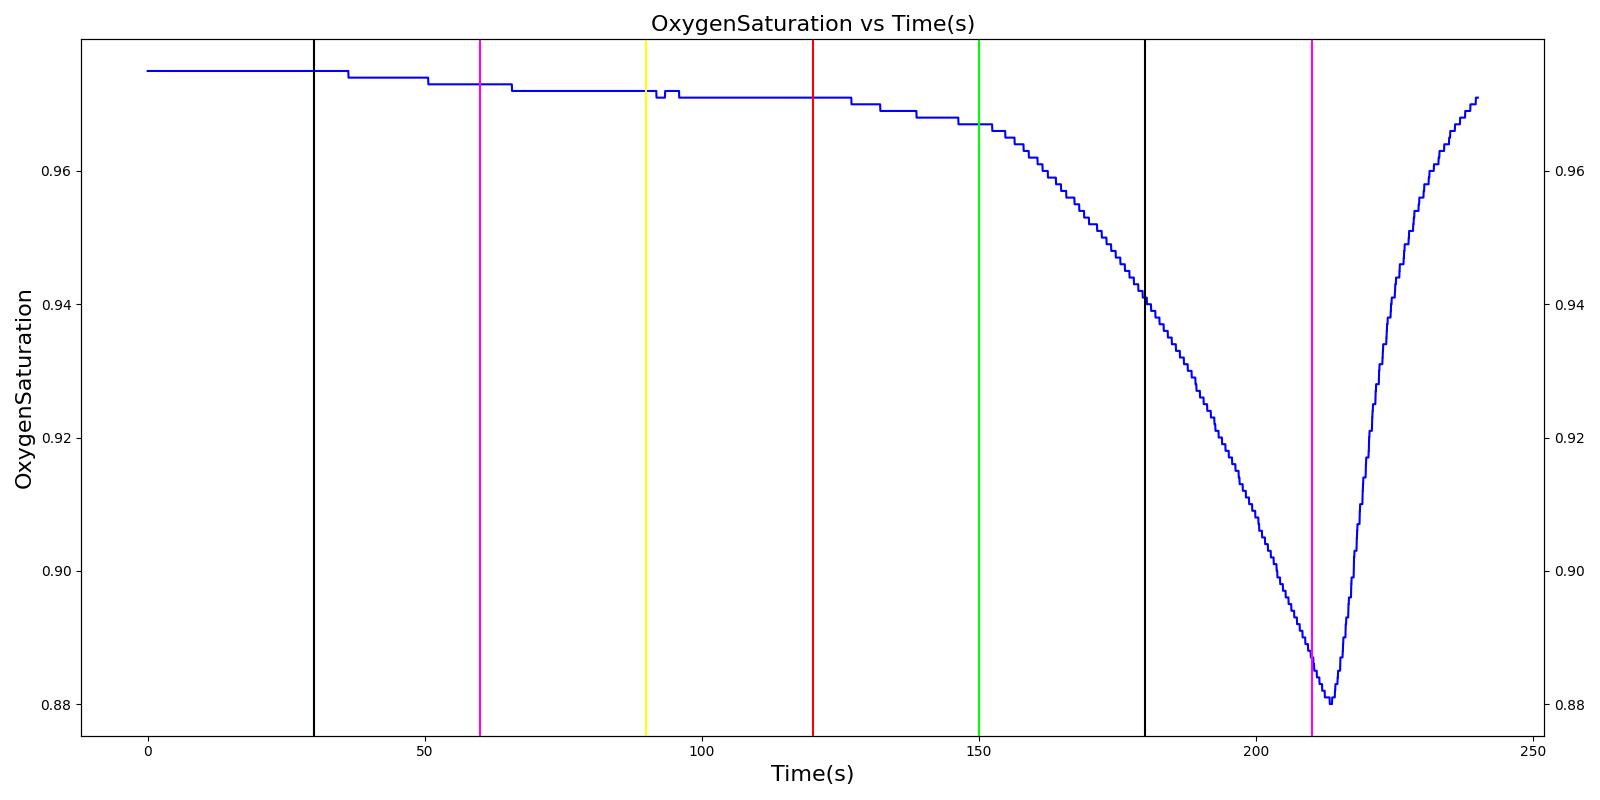 |
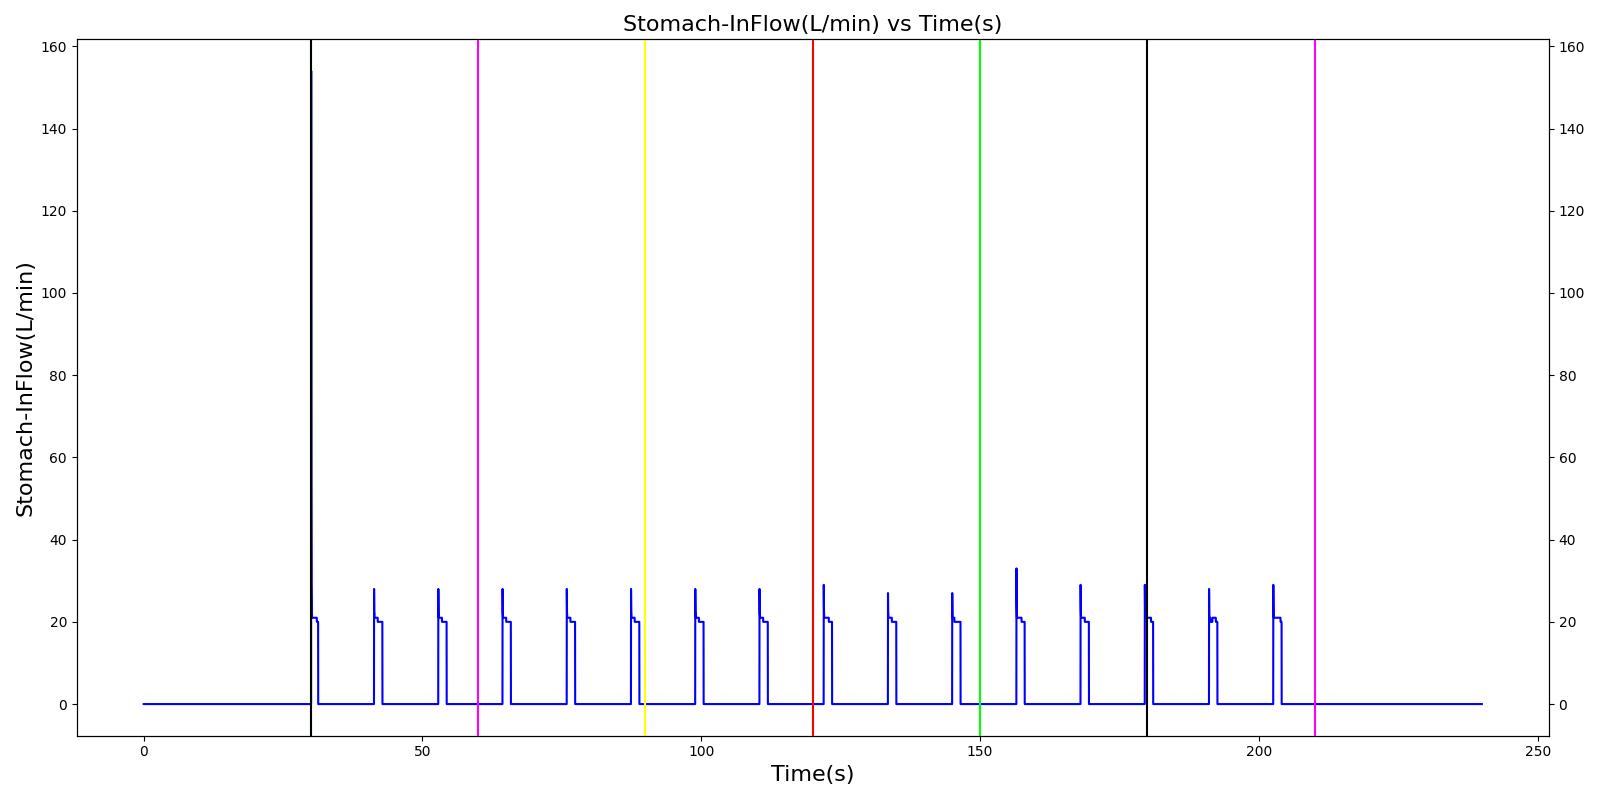 |
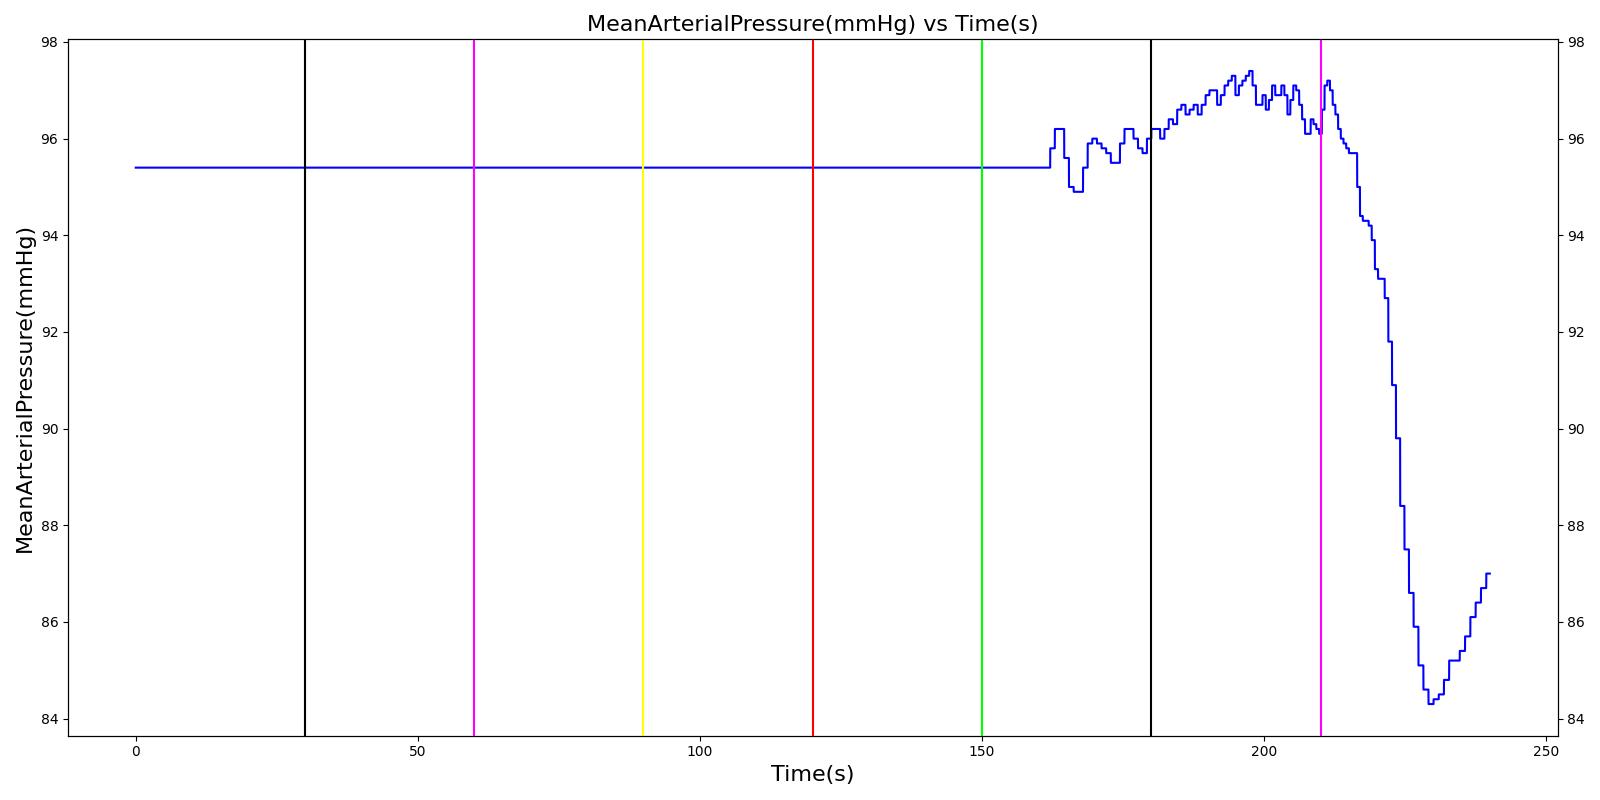 |
 |
|
| Segment | Notes | Action Occurrence Time (s) | Sample Scenario Time (s) | Respiration Rate (breaths/min) | Heart Rate (beats/min) | Systolic Pressure (mmHg) | Diastolic Pressure (mmHg) | Oxygen Saturation (mmHg) |
|---|---|---|---|---|---|---|---|---|
| Esophageal Intubation | This represents failed endotracheal intubation that led to esophageal intubation | 60 | 120 | Zero | If undetected and O2 level drops significantly, Mild Increase [253] | If undetected and O2 level drops significantly, Mild Increase [253] | If undetected and O2 level drops significantly, Mild Increase [253] | continue to decrease along O2 curve |
| Successful Intubation | Represents successful endotracheal intubation | 180 | 500 | 16 (set by machine) | Towards normal [226] | Towards normal [226] | Towards normal [226] | Towards normal [226] |
Asthma
The acute asthma action was validated against three scenarios: moderate (severity = 0.3), severe (severity = 0.7), and life-threatening (severity = 0.9).
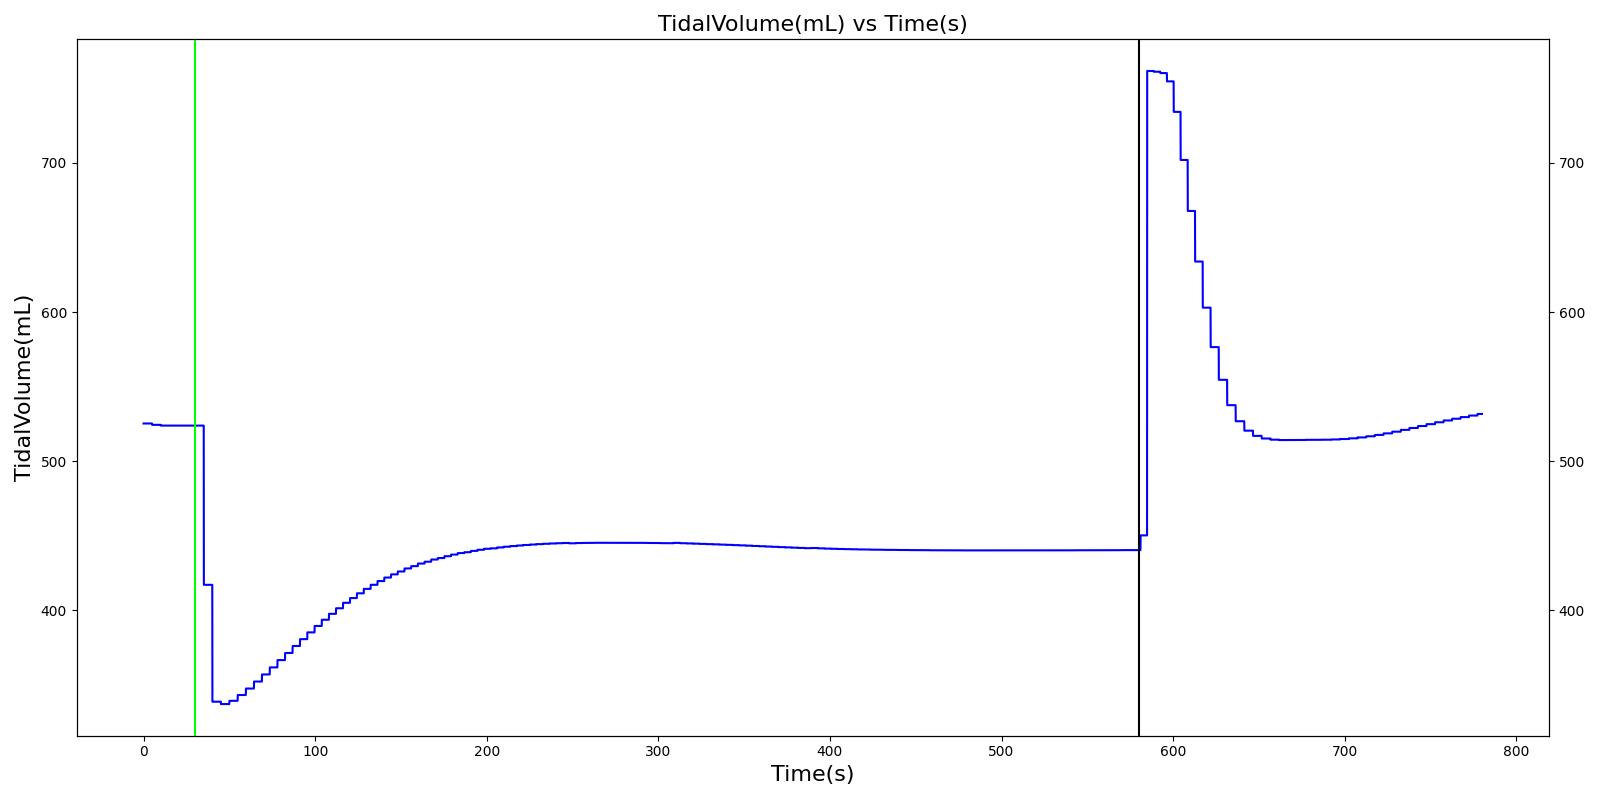 |
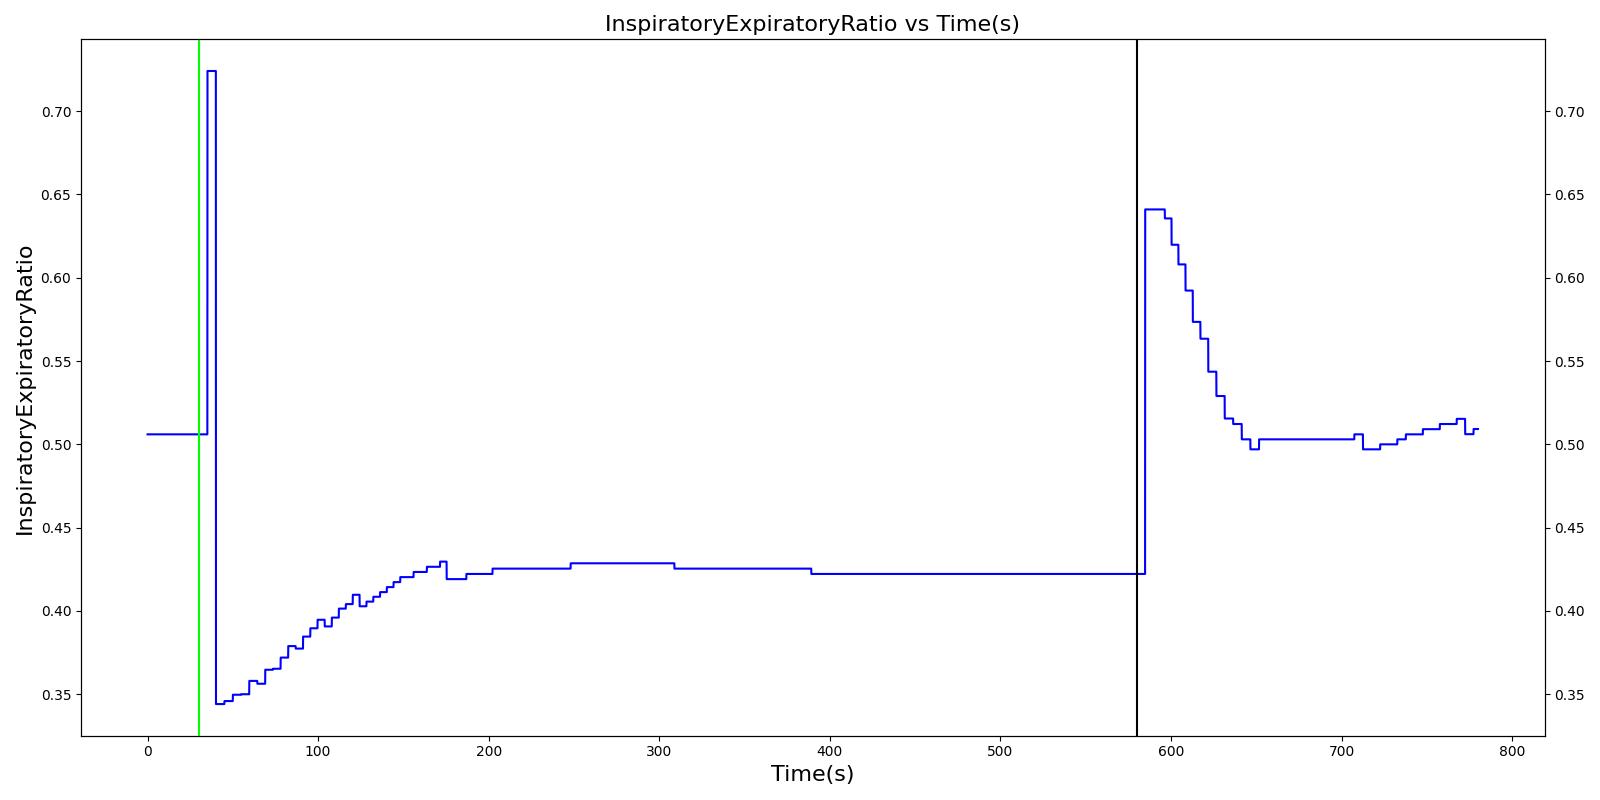 |
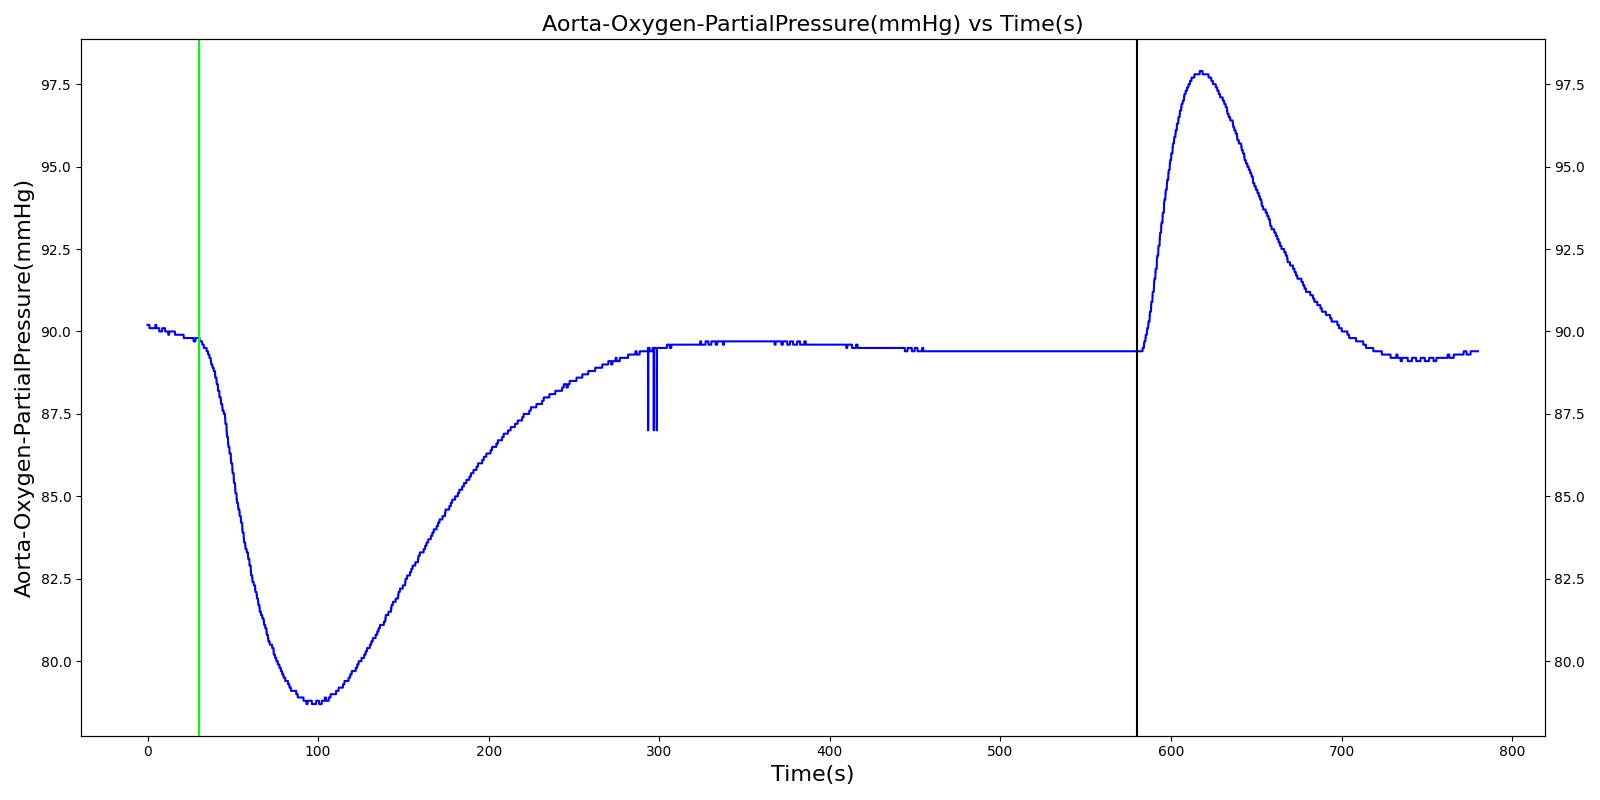 |
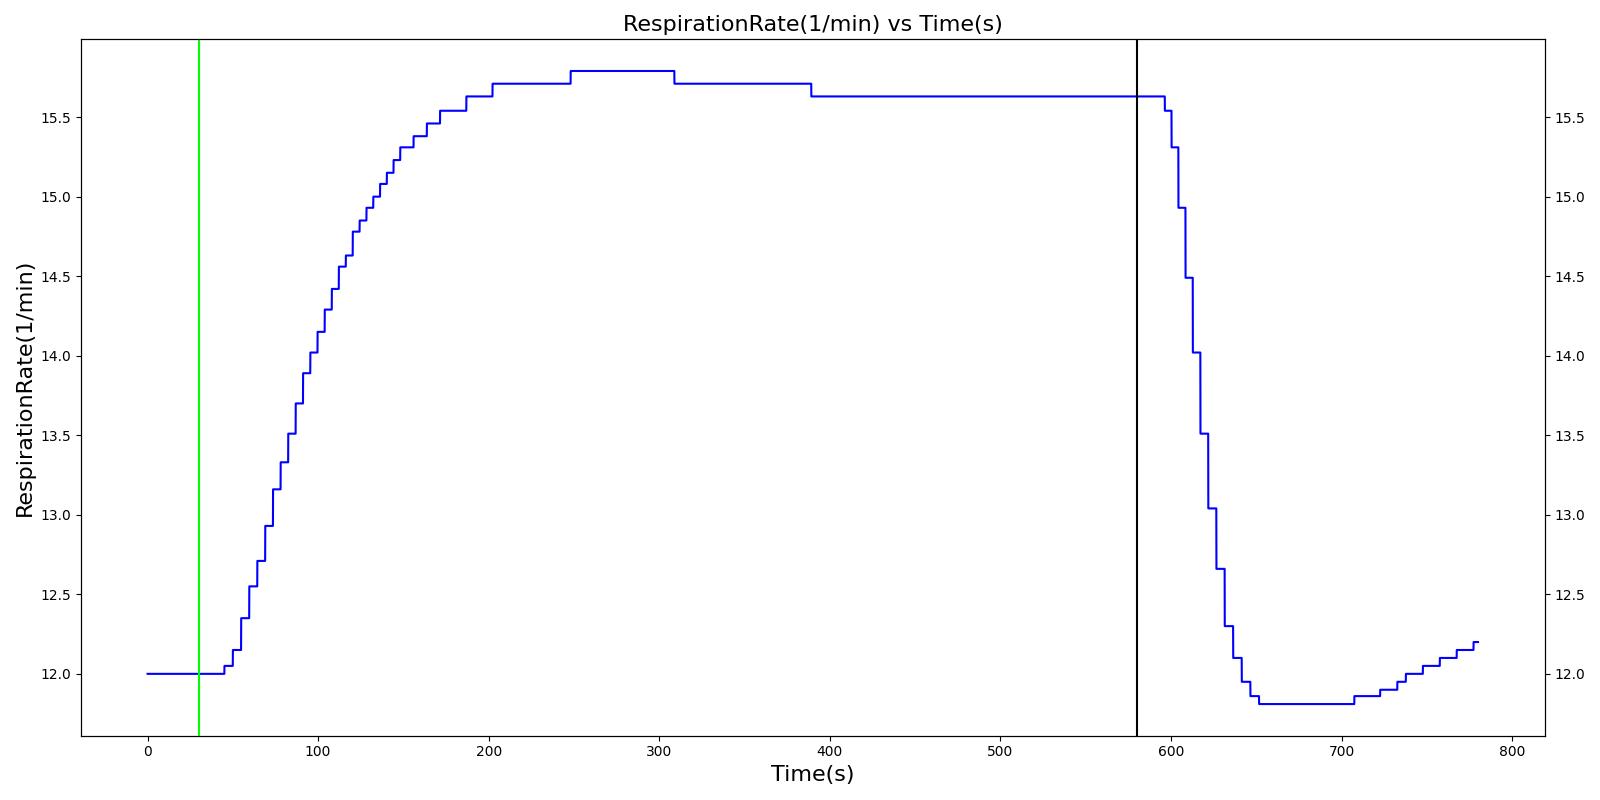 |
 |
|
| Segment | Notes | Action Occurrence Time (s) | Sampled Scenario Time (s) | Trachea Flow - Peak Expiratory Flow (L/min) | Respiration Rate (breaths/min) | Tidal Volume (mL) | Heart Rate (beats/min) | Systolic Pressure (mmHg) | Oxygen Saturation | PaO2 (mmHg) | PaCO2 (mmHg) | IERatio |
|---|---|---|---|---|---|---|---|---|---|---|---|---|
| Moderate acute asthma attack (Severity = 0.3) | 30 | 550 | 75% to 90% of normal [243] | Slight Increase [243] | ~95% of normal [209] | No Change [243] | No Change [261] | No Change [243] | No Change [243] | No Change [243] | Decrease [366] | |
| No asthma (Severity = 0.0) | 580 | 775 | Normal | Normal | Normal | Normal | Normal | Normal | Normal | Normal | Normal |
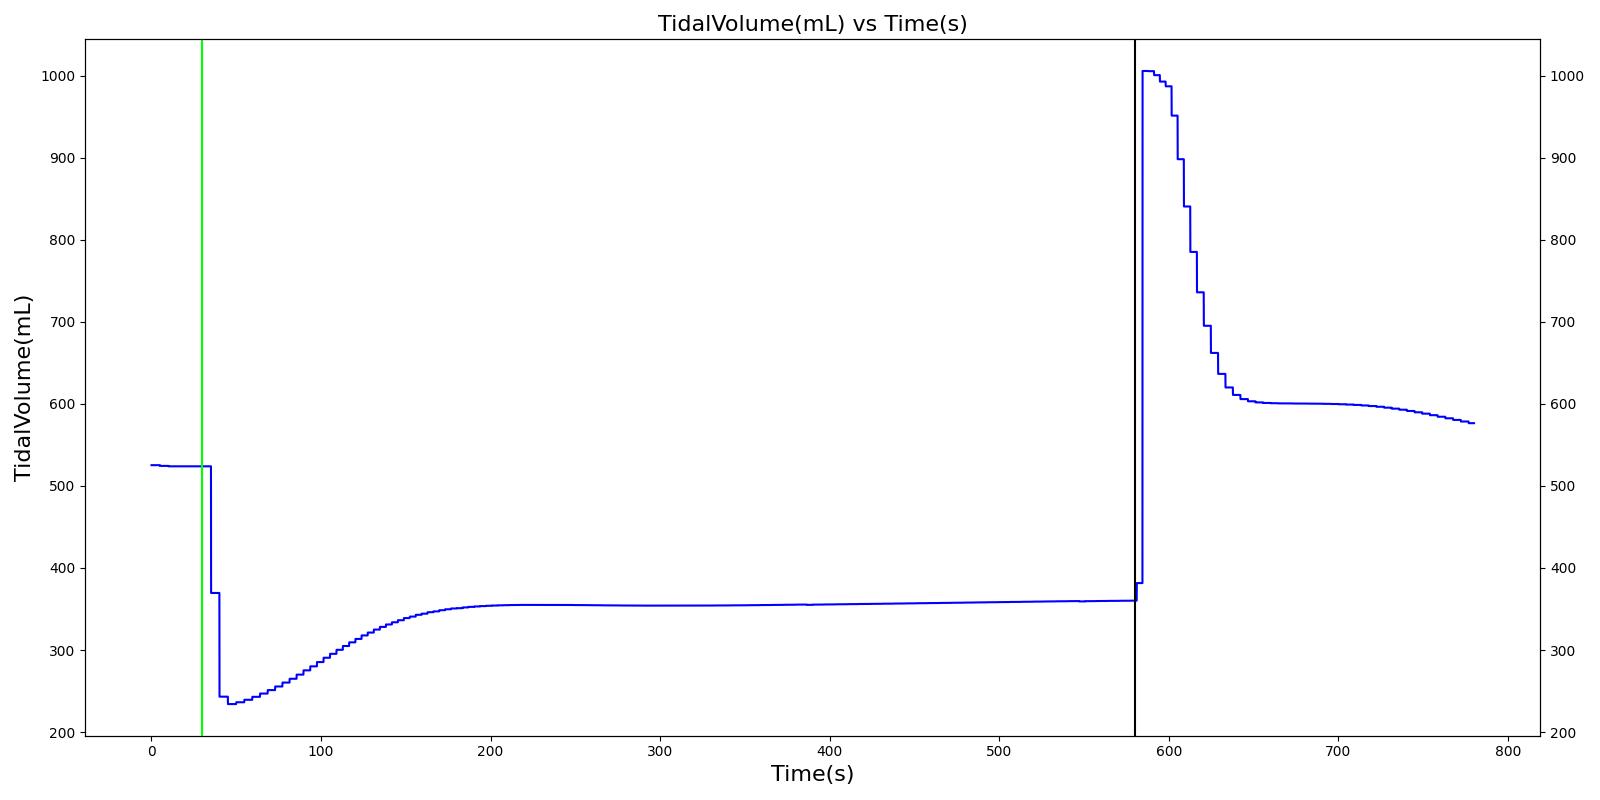 |
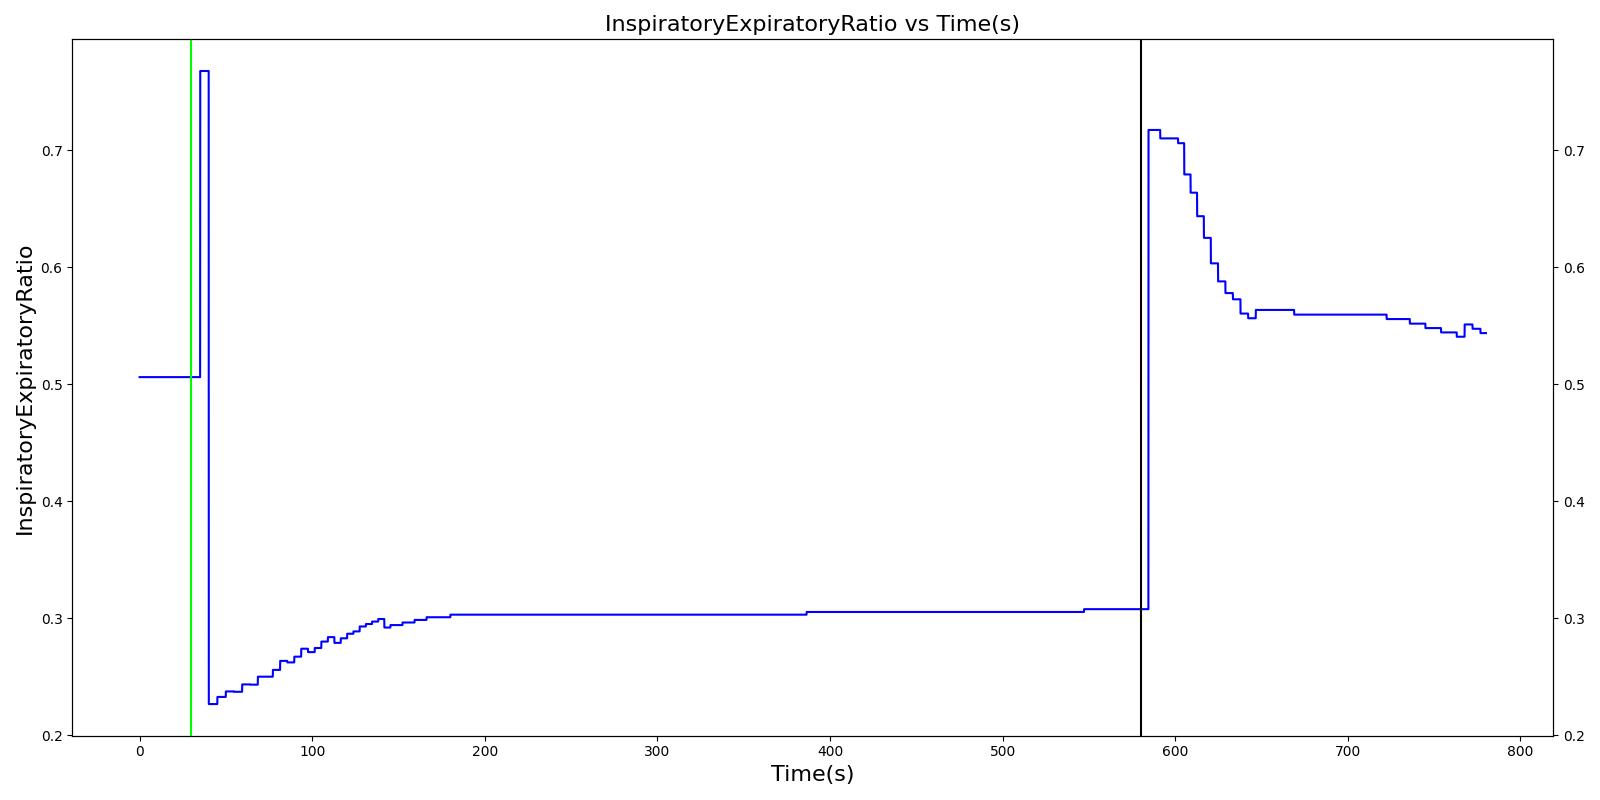 |
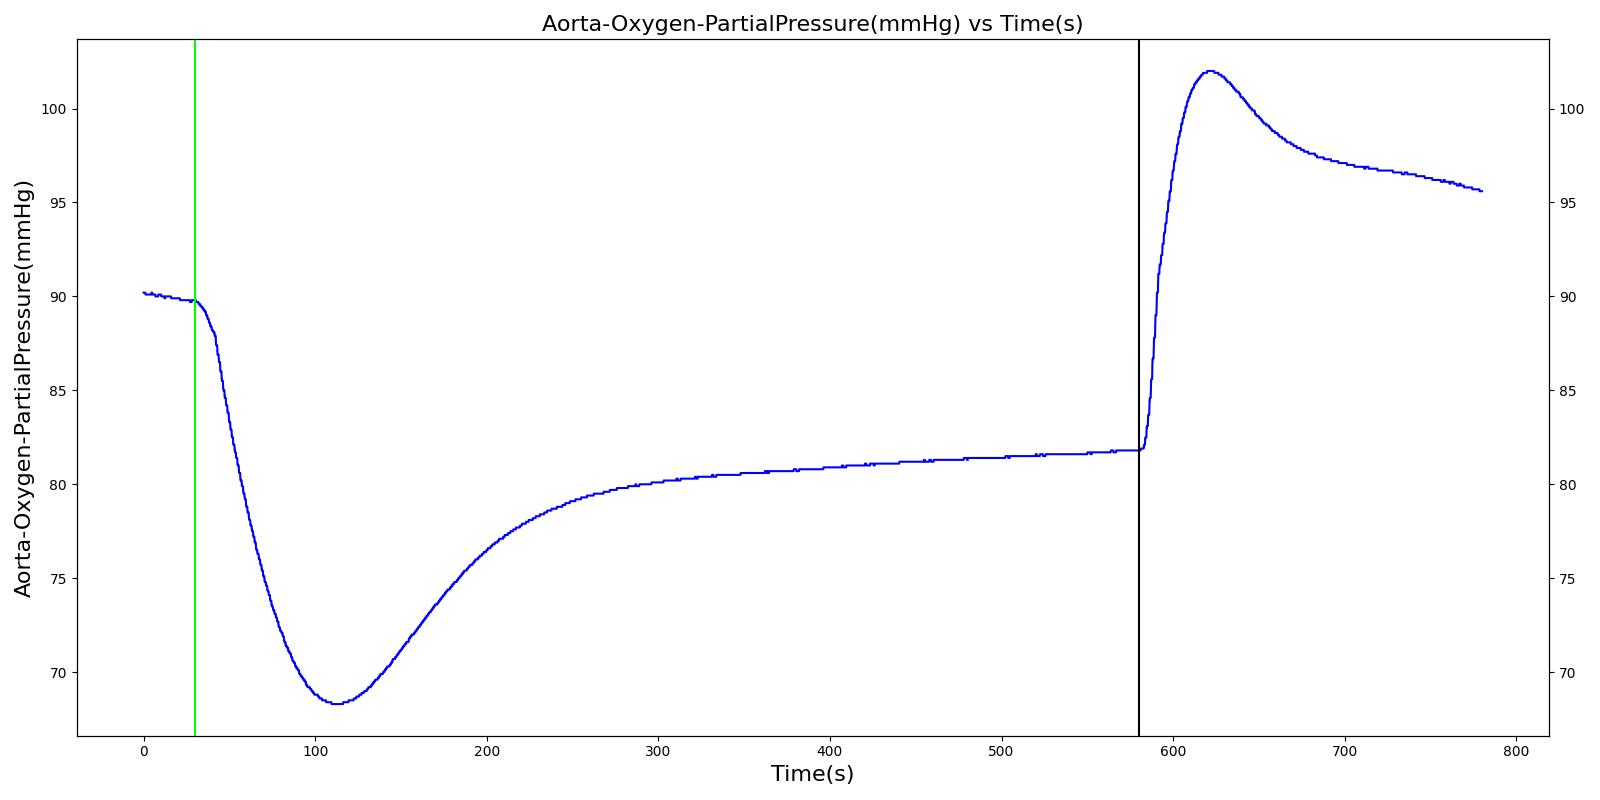 |
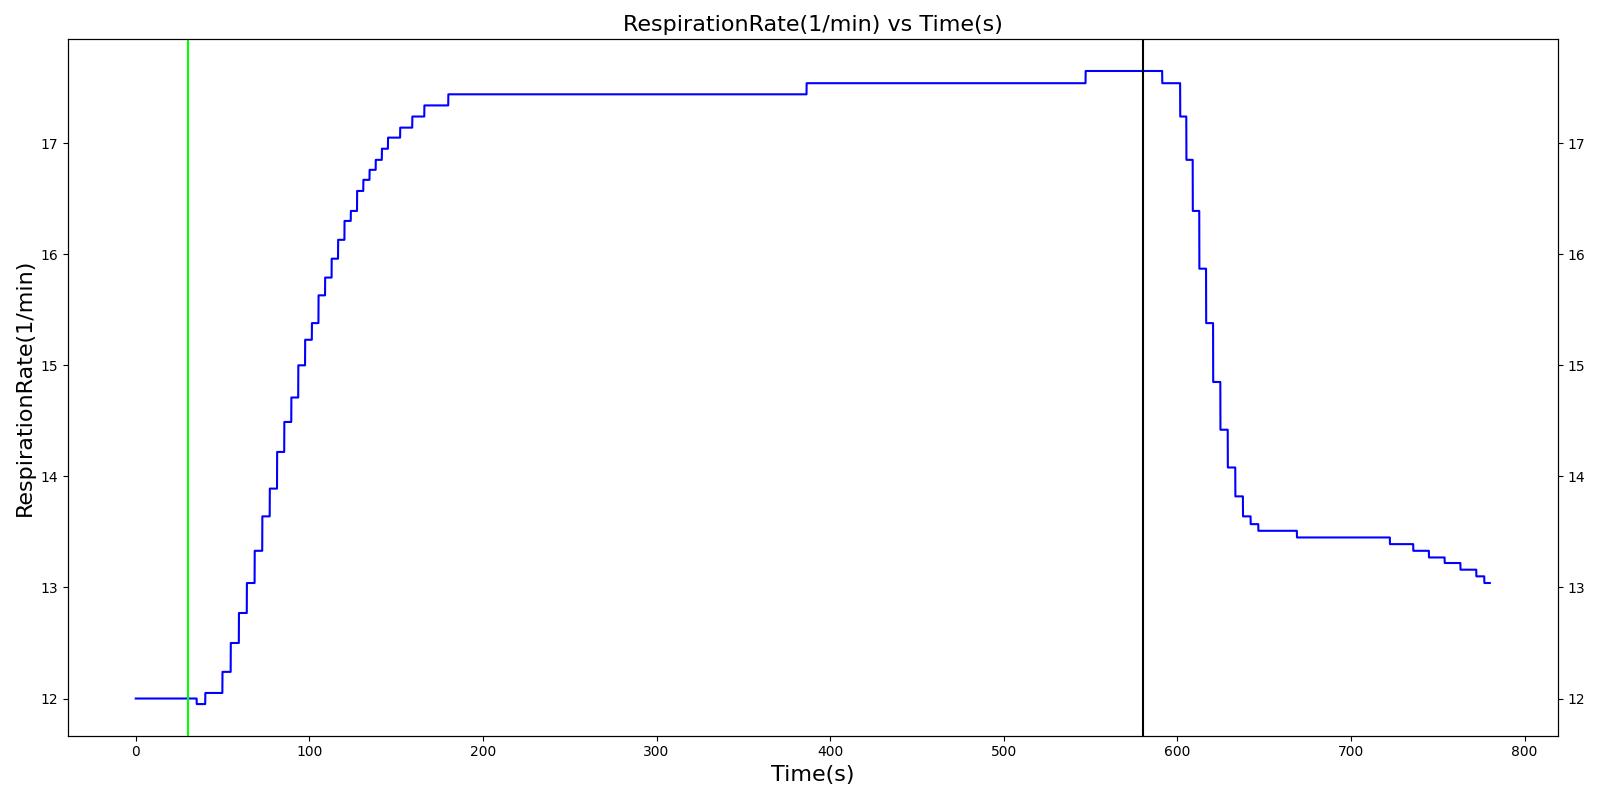 |
 |
|
Table 19. Validation matrix for physiological responses due to severe acute asthma and correction.
| Segment | Notes | Action Occurrence Time (s) | Sampled Scenario Time (s) | Trachea Flow - Peak Expiratory Flow (L/min) | Respiration Rate (breaths/min) | Tidal Volume (mL) | Heart Rate (beats/min) | Systolic Pressure (mmHg) | Oxygen Saturation | PaO2 (mmHg) | PaCO2 (mmHg) | IERatio |
|---|---|---|---|---|---|---|---|---|---|---|---|---|
| Severe acute asthma attack (Severity = 0.7) | 30 | 550 | < 50% of Normal [261], [243] | > 25 [243] | < 60% of normal [209] | > 120 [261]; > 110 [243] | Decrease Pulsus Paradoxus 85 mm Hg [261] | < 90% [261]; < 92% [243] | Decrease Mild Hypoxemia [226]; < 60 mmHg [261], [243] | Normal or Slight Increase > 45 mm Hg [261], [243] | Decrease [366] | |
| No asthma (Severity = 0.0) | 580 | 775 | Normal | Normal | Normal | Normal | Normal | Normal | Normal | Normal | Normal |
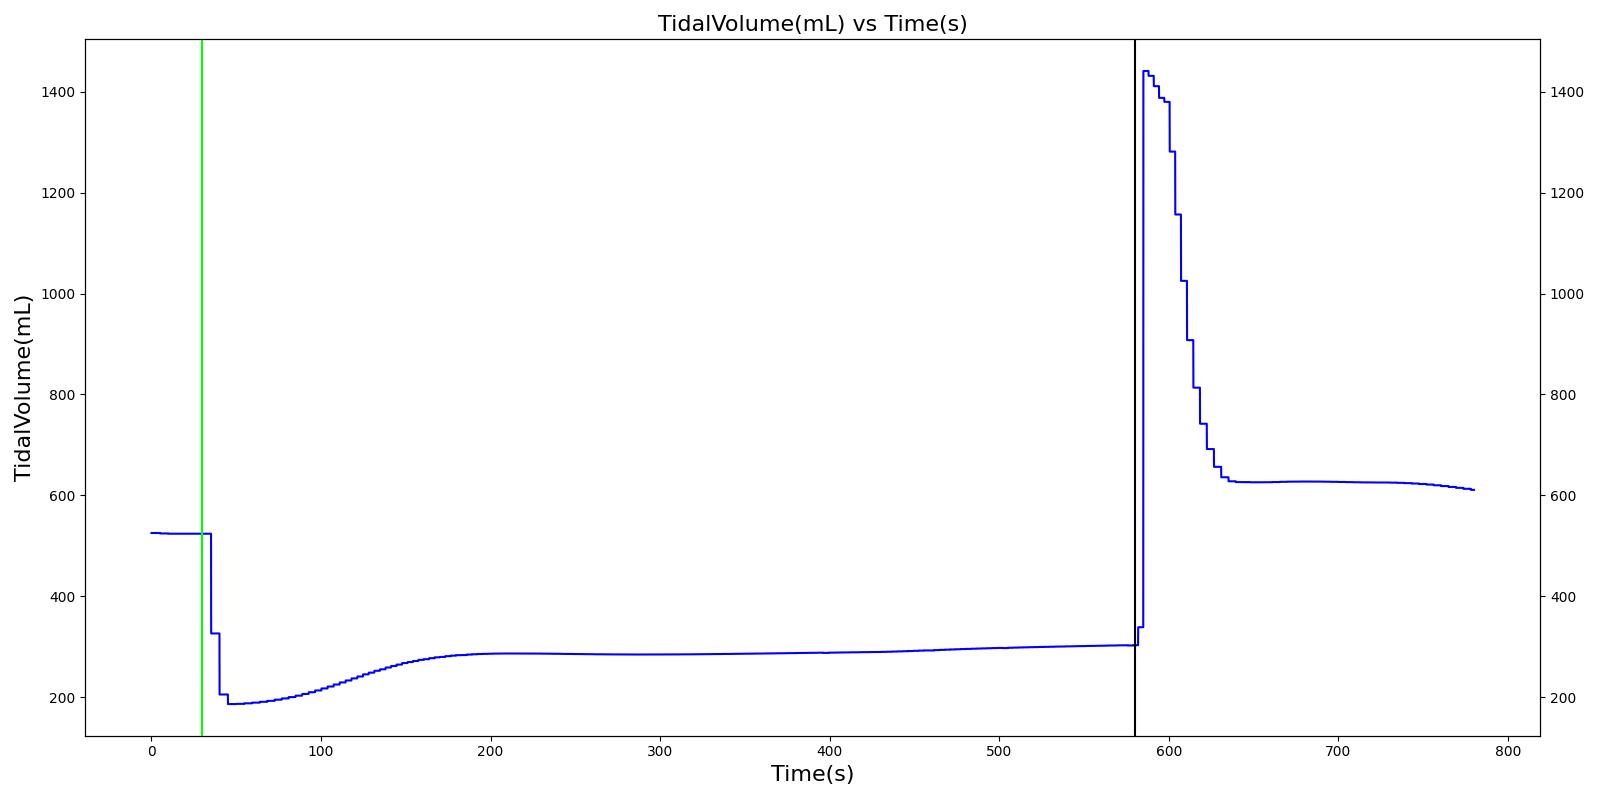 |
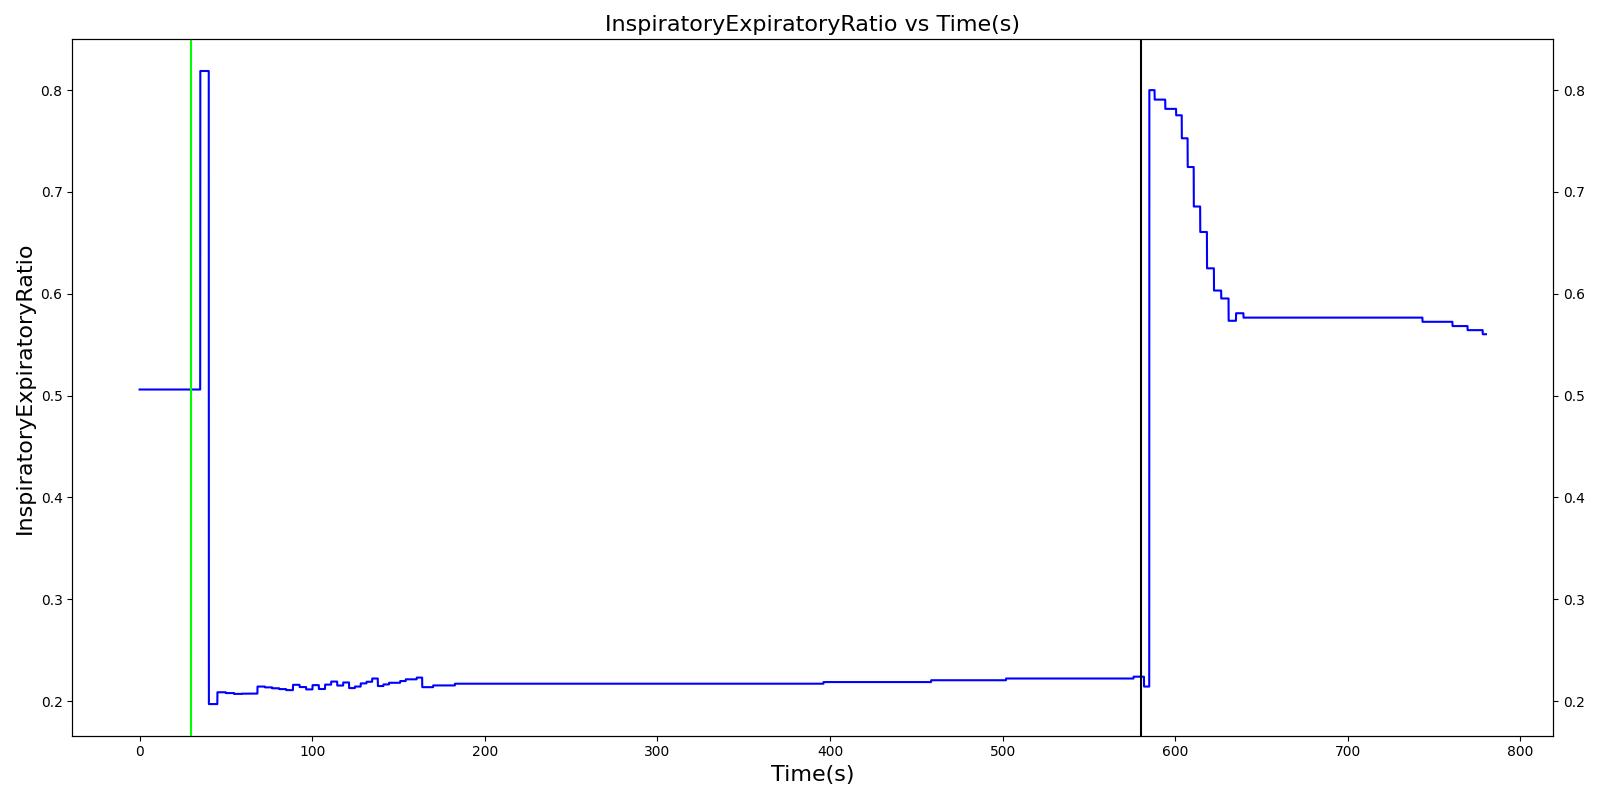 |
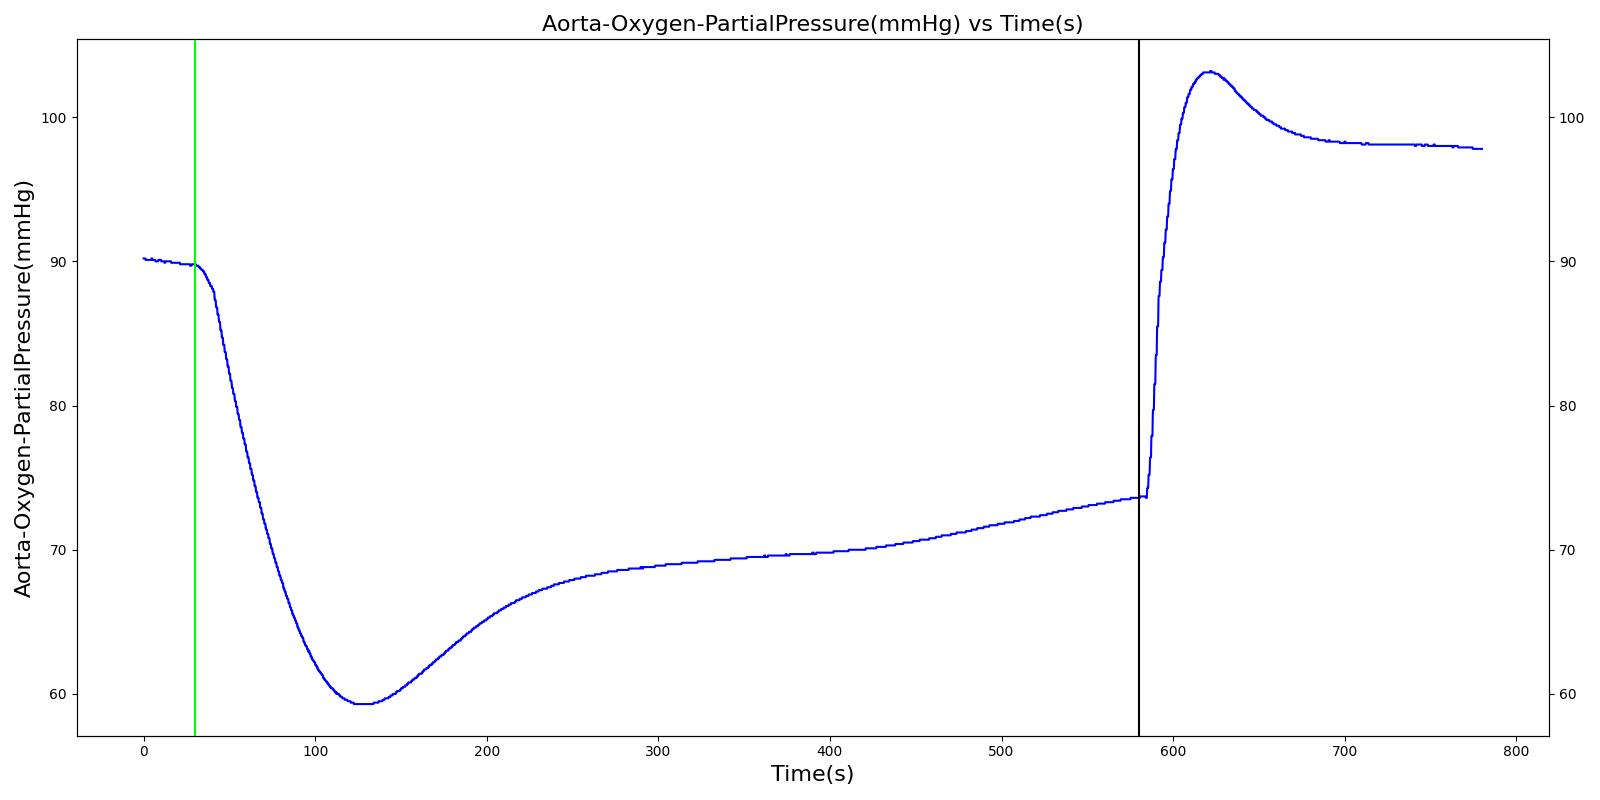 |
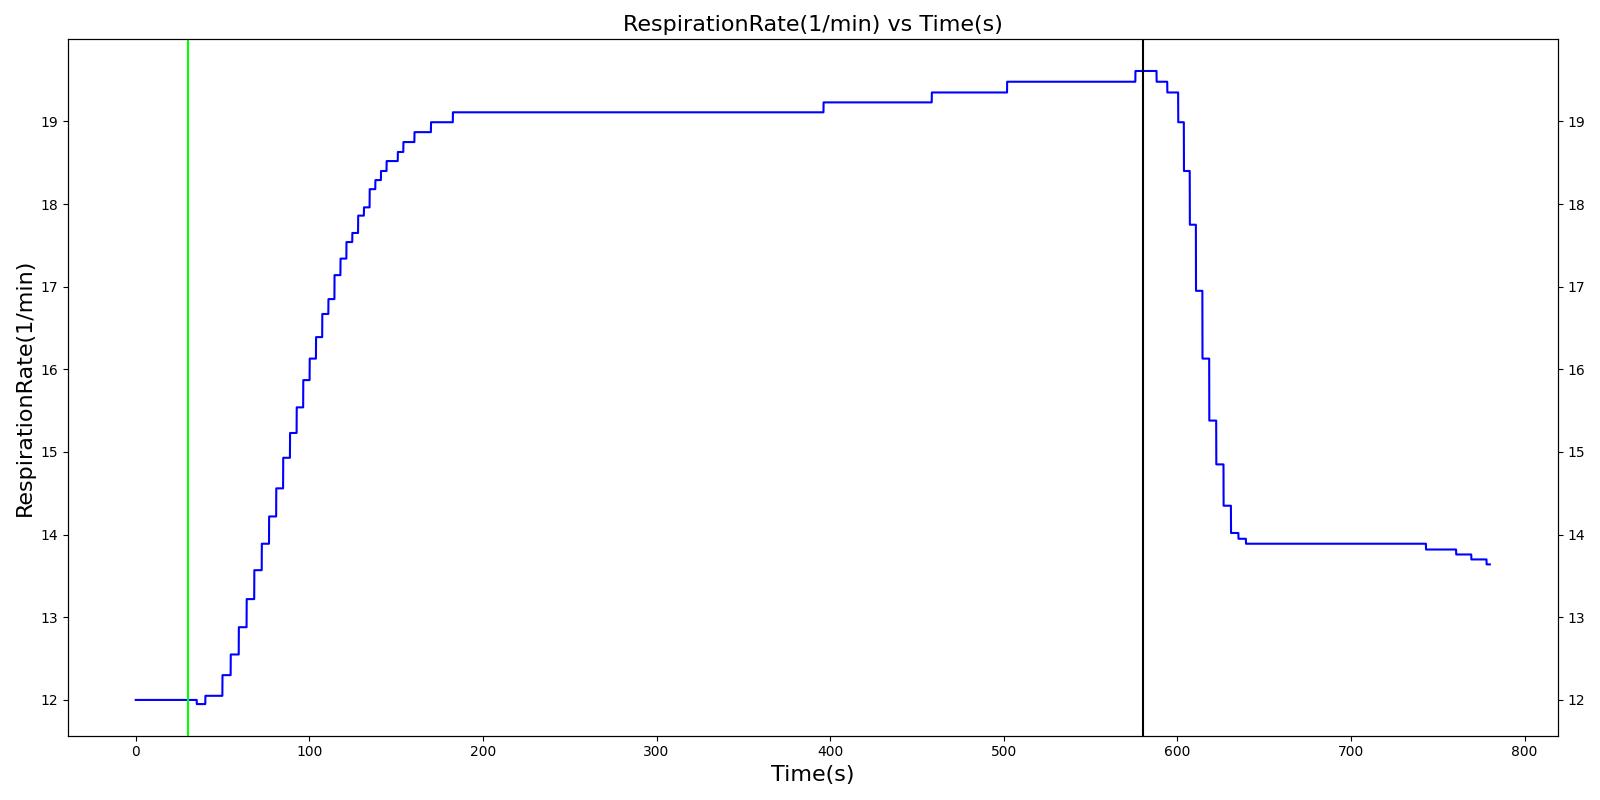 |
 |
|
| Segment | Notes | Action Occurance Time (s) | Sampled Scenario Time (s) | Trachea Flow - Peak Expiratory Flow (L/min) | Respiration Rate (breaths/min) | Tidal Volume (mL) | Heart Rate (beats/min) | Systolic Pressure (mmHg) | Oxygen Saturation | PaO2 (mmHg) | PaCO2 (mmHg) | IERatio |
|---|---|---|---|---|---|---|---|---|---|---|---|---|
| Life threatening acute asthma attack (Severity = 0.9) | 30 | 550 | < 33% of Normal [243] | > 25 [243] | < 60% of normal [209] | > 120 [261]; > 110 [243] Arrhythmia, [243] | Decrease NO Pulsus Paradoxus 85 mm Hg [261] | < 92% [243] | < 60 mmHg [243] | Normal or Slight Increase > 45 mm Hg [261], [243] | Decrease [366] | |
| No asthma (Severity = 0.0) | 580 | 775 | Normal | Normal | Normal | Normal | Normal | Normal | Normal | Normal | Normal |
Dyspnea
Dyspnea directly effects the achieved respiratory driver (breathing muscles) pressure amplitude. The more severe the dyspnea, the lower the tidal volume.
Table 21. Validation matrix for physiological responses due to varying severities of dyspnea.
| Segment | Notes | Action Occurrence Time (s) | Sampled Scenario Time (s) | Tidal Volume (mL) |
|---|---|---|---|---|
| Dysnea: Severity = 0.3 | Mild | 30 | 210 | Decrease to ~70% of healthy |
| Dysnea: Severity = 0.0 | Healthy | 210 | 510 | Normal |
| Dysnea: Severity = 0.6 | Moderate | 510 | 690 | Decrease to ~30% of healthy |
| Dysnea: Severity = 0.0 | Healthy | 690 | 990 | Normal |
| Dysnea: Severity = 1.0 | Severe | 990 | 1170 | Decrease to 0 |
| Dysnea: Severity = 0.0 | Healthy | 1170 | 1650 | Normal |
Supplemental Oxygen
The nasal cannula, simple mask, and non-rebreather mask are validated by applying the standard/default oxygen flow for each to the healthy standard male patient and looking at the oxygen fraction in the carina. All three supplemental oxygen devices match the expected fraction of inspired oxygen (FiO2).
Table 22. Validation matrix for application of a nasal cannula.
| Segment | Notes | Action Occurrence Time (s) | Sampled Scenario Time (s) | Fraction of Inspired Oxygen (FiO2) |
|---|---|---|---|---|
| Supplemental Oxygen: Nasal Cannula | Default flow = 3.5 L/min | 30 | 330 | Increase to ~0.4 [195], [23] |
Table 23. Validation matrix for application of a simple mask.
| Segment | Notes | Action Occurrence Time (s) | Sampled Scenario Time (s) | Fraction of Inspired Oxygen (FiO2) |
|---|---|---|---|---|
| SupplementalOxygen: Simple Mask | Default flow = 7.5 L/min | 30 | 330 | Increase to ~0.5 [195], [23] |
Table 24. Validation matrix for application of a non-rebreather mask.
| Segment | Notes | Action Occurance Time (s) | Sampled Scenario Time (s) | Fraction of Inspired Oxygen (FiO2) |
|---|---|---|---|---|
| SupplementalOxygen: Non-Rebreather Mask | Default flow = 10.0 L/min | 30 | 330 | Increase to ~0.9 [195], [23] |
Conscious Respiration
Conscious respiration is validated as part of inhaler usage described in the Inhaler methodology section Inhaler Methodology.
Validation - Assessments
Conclusion
Mathematical modeling of the pulmonary physiology dates back to the work of Gray (1945) and others, including Guyton and collaborators [230] . Since then several mathematical models have been developed that describe aspects of the pulmonary physiology in considerable detail. However, the scope and complexity of the human physiology demands a model that integrates the dynamic respiratory physiology with other systems such as cardiovascular, renal, and others. As a result, there is a need for an integrative modeling environment that serves as a tool for predicting aspects of the human physiology and pathology.
The Respiratory Model provides a system-level computational model that allows for real-time simulation of normal pulmonary physiology and respiratory distresses. The model employs a circuit-based lumped parameter mathematical model that allows for the characterization of patient-specific respiratory mechanics at a relatively low computational burden. The coupling of the Respiratory System with the Circulatory System through gas exchange and respiratory distress modifiers permits robust prediction of respiratory effects on hemodynamic variables. Accordingly, the current version of the Respiratory System is capable of predicting respiratory and hemodynamic responses to various insults like airway obstruction, bronchoconstriction, pneumothorax, and others.
As part of a modeling tool for various clinical settings, the Respiratory Model can be hooked up to the anesthesia machine for mechanical ventilation. During positive pressure ventilation, the Respiratory Model permits the transport of inhaled volatile gases and others from the anesthesia machine to the circulatory system. Such an integrative approach allows for the examination of respiratory and cardiovascular responses to various stimuli and stresses as observed in practical application.
The Respiratory System, along with the other systems in the engine, can serve as a training tool for exploring the dynamic interaction between physiological systems. Researchers can benefit from the integration of higher-fidelity modules into the existing model for more detailed and project-specific analysis. In its current form, the Respiratory Model is adapted to a specific patient using physiological parameters selected from patient data. This limits the practical application of the model to the tested standard model. However, the common data model platform gives the user the ease and flexibility to select parameters to experiment their own patient setting.
Future Work
Coming Soon
We are actively designing and implementing work of breathing and respiratory muscle fatigue models.
Recommended Improvements
There are several more pathophysiology models that could be added, such as pulmonary edema and sepsis.
Some models would benefit by applying a distinct inhalation and exhalation resistance value. The current implementation uses single resistance values for both inhalation and exhalation.
It may be beneficial to further define pneumothorax as either spontaneous (action) or traumatic (condition), and add a simple (as opposed to tension) option. A tube thoracostomy intervention model could also be added.
A respiratory control mechanism for rhythmic breathing could be added to the engine. Rhythmic breathing is achieved by the respiratory neurons in the medullary respiratory center that give rise to activity in the efferent nerves ennervating the respiratory muscles. The neural control network that relates the respiratory neuron output to the mechanical airflow is not incorporated in the current version of the Respiratory Model. The current version of the Respiratory Model has succeeded in controlling the breathing cycle through parameters that adjust the spontaneous breathing based on a chemical control feedback mechanism. While this development allows robust chemical stimuli responses, incorporation of the neural circuitry model that controls the ventilation process can provide a more accurate implementation of the Respiratory System that includes behavioral control of breathing.
Appendices
Acronyms
ARDS - Acute Respiratory Distress Syndrome
COPD - Chronic Obstructive Pulmonary Disease
RV - Residual volume
ERV - Expiratory reserve volume
VT - Tidal volume
IRV - Inspiratory reserve volume
VC - Vital capacity
IC - Inspiratory capacity
FRC - Functional residual capacity
TLC - Total lung capacity
RR - Respiration rate
V.E - Minute ventilation
V.A - Alveolar ventilation
PaO2 - Arterial blood oxygen partial pressure
FiO2 - Fraction of inspired oxygen
IE Ratio - Inspiratory:Expiratory Ratio
Data Model Implementation
Compartments
- Mouth
- Stomach
- Carina
- Lungs
- LeftLung
- LeftAnatomicDeadSpace
- LeftAlveolarDeadSpace
- LeftAlveoli
- RightLung, RightLungPulmonary
- RightAnatomicDeadSpace
- RightAlveolarDeadSpace
- RightAlveoli
- LeftLung
- PleuralCavity
- LeftPleuralCavity
- RightPleuralCavity
- LeftAlveoliLeak
- LeftChestLeak
- RightAlveoliLeak
- RightChestLeak